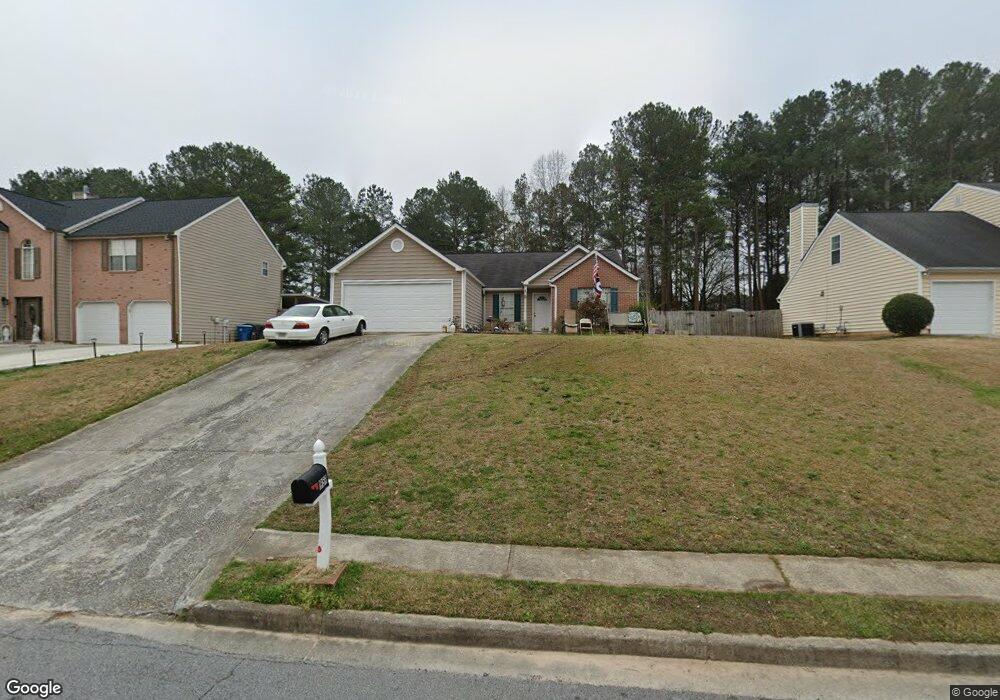
1959 Manor Oak Ln Unit 1 Buford, GA 30519
Estimated Value: $368,763 - $417,000
4
Beds
2
Baths
1,846
Sq Ft
$208/Sq Ft
Est. Value
About This Home
This home is located at 1959 Manor Oak Ln Unit 1, Buford, GA 30519 and is currently estimated at $384,191, approximately $208 per square foot. 1959 Manor Oak Ln Unit 1 is a home located in Gwinnett County with nearby schools including Woodward Mill Elementary School, Twin Rivers Middle School, and Mountain View High School.
Ownership History
Date
Name
Owned For
Owner Type
Purchase Details
Closed on
Sep 19, 2001
Sold by
Clark David N
Bought by
Scarbrough Roger D and Scarbrough Karen D
Current Estimated Value
Home Financials for this Owner
Home Financials are based on the most recent Mortgage that was taken out on this home.
Original Mortgage
$105,600
Interest Rate
6.51%
Mortgage Type
New Conventional
Purchase Details
Closed on
Apr 4, 2001
Sold by
Clark Tammy S
Bought by
Clark David N
Purchase Details
Closed on
Nov 17, 1997
Sold by
Diversified Shelter Group
Bought by
Clark David N and Clark Tammy S
Home Financials for this Owner
Home Financials are based on the most recent Mortgage that was taken out on this home.
Original Mortgage
$110,450
Interest Rate
7.35%
Mortgage Type
FHA
Create a Home Valuation Report for This Property
The Home Valuation Report is an in-depth analysis detailing your home's value as well as a comparison with similar homes in the area
Home Values in the Area
Average Home Value in this Area
Purchase History
| Date | Buyer | Sale Price | Title Company |
|---|---|---|---|
| Scarbrough Roger D | $132,000 | -- | |
| Clark David N | -- | -- | |
| Clark David N | $110,500 | -- |
Source: Public Records
Mortgage History
| Date | Status | Borrower | Loan Amount |
|---|---|---|---|
| Closed | Scarbrough Roger D | $105,600 | |
| Previous Owner | Clark David N | $110,450 |
Source: Public Records
Tax History Compared to Growth
Tax History
| Year | Tax Paid | Tax Assessment Tax Assessment Total Assessment is a certain percentage of the fair market value that is determined by local assessors to be the total taxable value of land and additions on the property. | Land | Improvement |
|---|---|---|---|---|
| 2025 | $596 | $129,360 | $26,000 | $103,360 |
| 2024 | $701 | $129,800 | $28,000 | $101,800 |
| 2023 | $701 | $129,440 | $28,000 | $101,440 |
| 2022 | $389 | $89,240 | $16,000 | $73,240 |
| 2021 | $366 | $79,640 | $16,000 | $63,640 |
| 2020 | $363 | $79,640 | $16,000 | $63,640 |
| 2019 | $356 | $75,440 | $16,000 | $59,440 |
| 2018 | $345 | $71,800 | $16,000 | $55,800 |
| 2016 | $2,107 | $57,880 | $12,400 | $45,480 |
| 2015 | $1,888 | $48,920 | $8,400 | $40,520 |
| 2014 | $1,897 | $48,920 | $8,400 | $40,520 |
Source: Public Records
Map
Nearby Homes
- 1880 Rocksram Dr Unit 1
- 2375 Rock Springs Rd
- 1935 Charleston Oak Cir
- 2199 Sunny Hill Rd
- 2159 Sunny Hill Rd
- 2115 Sun Valley Ct
- 2500 Sunny Hill Rd
- 2506 Sunny Hill Rd
- 2415 Mitchell Rd
- 2423 Walnut Tree Ln Unit 1
- 2365 Valley Mill Dr Unit 1
- 2493 Walnut Tree Ln Unit 1
- 2238 Saint Albans Place
- 1876 Hanover West Dr
- 2147 Saint Albans Place
- 2066 Holland Creek Ct
- 2555 Rexs Place
- 2012 Arbor Springs Way
- 2053 Arbor Springs Way
- 2557 Woodford Ln
- 1969 Manor Oak Ln Unit 1
- 1949 Manor Oak Ln Unit 18
- 1949 Manor Oak Ln
- 1979 Manor Oak Ln
- 1939 Manor Oak Ln
- 1989 Manor Oak Ln
- 1964 Manor Oak Ln
- 1954 Manor Oak Ln
- 1929 Manor Oak Ln
- 1974 Manor Oak Ln
- 1944 Manor Oak Ln
- 1934 Manor Oak Ln
- 1984 Manor Oak Ln Unit 1
- 1950 Rocksram Dr Unit 2
- 1999 Manor Oak Ln Unit 1
- 1999 Manor Oak Ln
- 1960 Rocksram Dr
- 1940 Rocksram Dr Unit 1
- 1919 Manor Oak Ln Unit 1
- 1924 Manor Oak Ln Unit 1