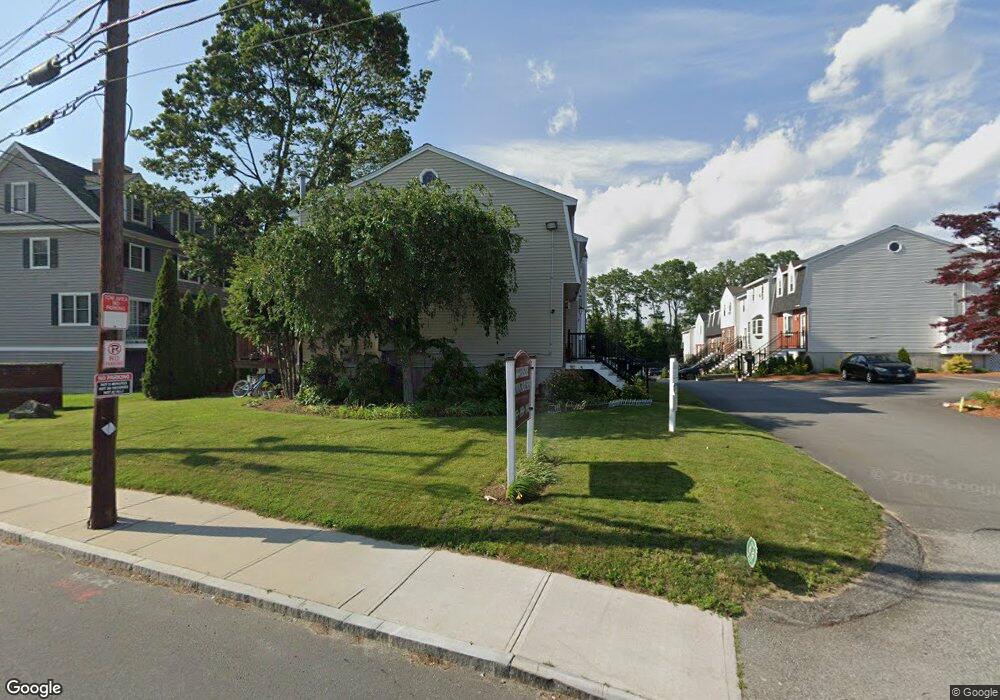
1959 Middlesex St Unit F Lowell, MA 01851
Highlands NeighborhoodEstimated Value: $362,000 - $381,000
2
Beds
2
Baths
1,202
Sq Ft
$307/Sq Ft
Est. Value
About This Home
This home is located at 1959 Middlesex St Unit F, Lowell, MA 01851 and is currently estimated at $369,373, approximately $307 per square foot. 1959 Middlesex St Unit F is a home located in Middlesex County with nearby schools including Charles W. Morey Elementary School, Dr. Gertrude Bailey Elementary School, and Joseph McAvinnue Elementary School.
Ownership History
Date
Name
Owned For
Owner Type
Purchase Details
Closed on
Oct 12, 2019
Sold by
Patel Usha K and Patel Varsha C
Bought by
Kj Realty Group Llc
Current Estimated Value
Purchase Details
Closed on
Dec 8, 2017
Sold by
Patel Niral and Patel Sneha N
Bought by
Patel Usha K and Patel Varsha C
Purchase Details
Closed on
Sep 30, 2009
Sold by
Patel Rajendra H and Patel Minaxiben R
Bought by
Patel Niral and Patel Dhaval
Home Financials for this Owner
Home Financials are based on the most recent Mortgage that was taken out on this home.
Original Mortgage
$70,000
Interest Rate
5.12%
Mortgage Type
Purchase Money Mortgage
Purchase Details
Closed on
Sep 24, 2008
Sold by
Patel Minaxiben R and Patel Rajendra H
Bought by
Patel Dhaval R and Patel Minaxiben R
Purchase Details
Closed on
Sep 18, 2001
Sold by
Malkin Gary S
Bought by
Patel Rajendra H and Patel Minaxiben R
Home Financials for this Owner
Home Financials are based on the most recent Mortgage that was taken out on this home.
Original Mortgage
$87,360
Interest Rate
6.99%
Mortgage Type
Purchase Money Mortgage
Create a Home Valuation Report for This Property
The Home Valuation Report is an in-depth analysis detailing your home's value as well as a comparison with similar homes in the area
Home Values in the Area
Average Home Value in this Area
Purchase History
| Date | Buyer | Sale Price | Title Company |
|---|---|---|---|
| Kj Realty Group Llc | -- | -- | |
| Patel Usha K | $185,126 | -- | |
| Patel Niral | -- | -- | |
| Patel Dhaval R | -- | -- | |
| Patel Rajendra H | $109,201 | -- |
Source: Public Records
Mortgage History
| Date | Status | Borrower | Loan Amount |
|---|---|---|---|
| Previous Owner | Patel Rajendra H | $65,000 | |
| Previous Owner | Patel Niral | $70,000 | |
| Previous Owner | Patel Rajendra H | $95,000 | |
| Previous Owner | Patel Rajendra H | $87,360 | |
| Previous Owner | Patel Rajendra H | $88,000 |
Source: Public Records
Tax History Compared to Growth
Tax History
| Year | Tax Paid | Tax Assessment Tax Assessment Total Assessment is a certain percentage of the fair market value that is determined by local assessors to be the total taxable value of land and additions on the property. | Land | Improvement |
|---|---|---|---|---|
| 2025 | $3,599 | $313,500 | $0 | $313,500 |
| 2024 | $3,194 | $268,200 | $0 | $268,200 |
| 2023 | $2,937 | $236,500 | $0 | $236,500 |
| 2022 | $2,595 | $204,500 | $0 | $204,500 |
| 2021 | $2,680 | $199,100 | $0 | $199,100 |
| 2020 | $2,122 | $158,800 | $0 | $158,800 |
| 2019 | $2,246 | $160,000 | $0 | $160,000 |
| 2018 | $2,183 | $154,300 | $0 | $154,300 |
| 2017 | $2,166 | $145,200 | $0 | $145,200 |
| 2016 | $2,103 | $138,700 | $0 | $138,700 |
| 2015 | $2,019 | $130,400 | $0 | $130,400 |
| 2013 | $1,807 | $120,400 | $0 | $120,400 |
Source: Public Records
Map
Nearby Homes
- 1975 Middlesex St Unit 51
- 1975 Middlesex St Unit 10
- 24 Brouilette St Unit A
- Lot Amherst St
- 90 Corey St
- 2 Walter G Wiede St Unit 7
- 1821 Middlesex St Unit 10
- 620 Princeton Blvd Unit 13
- 4 Tamarack St
- 527 Pawtucket Blvd Unit 304
- 527 Pawtucket Blvd Unit 206
- 105 Lauriat St
- 3 Louis Farm Rd Unit 3
- 6 Louis Farm Rd Unit 6
- 10 Louis Farm Rd Unit 10
- 20 Sandy Ln
- 67 Lisa Ln
- 1184 Varnum Ave
- 101 Laurie Ln
- 345 Pawtucket Blvd Unit 5
- 1959 Middlesex St Unit D
- 1959 Middlesex St Unit C
- 1959 Middlesex St Unit A
- 1959 Middlesex St Unit E
- 1959 Middlesex St Unit G
- 1959 Middlesex St Unit H
- 1959 Middlesex St Unit B
- 1959 Middlesex St Unit 1959C
- 1959 Middlesex St Unit A,1959
- 1975 Middlesex St Unit 3
- 1955 Middlesex St Unit B
- 1955 Middlesex St Unit A
- 1955 Middlesex St Unit E
- 1955 Middlesex St Unit C
- 1955 Middlesex St Unit I
- 1955 Middlesex St Unit H
- 1955 Middlesex St Unit J
- 1955 Middlesex St Unit F
- 1955 Middlesex St Unit D
- 1955 Middlesex St Unit G