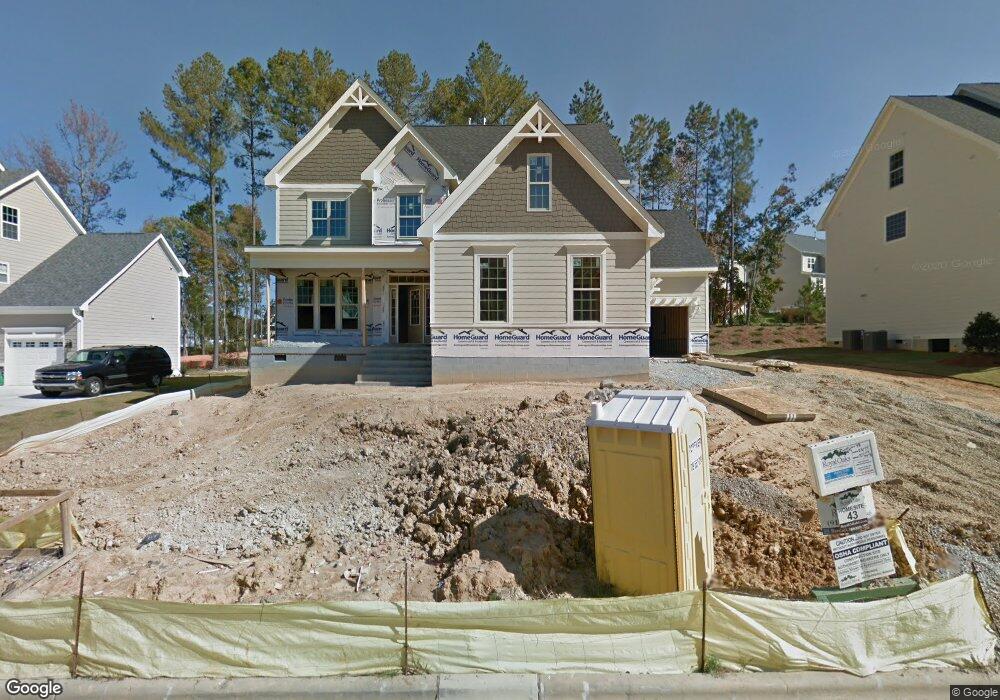
1959 Old Byre Way Apex, NC 27502
Friendship NeighborhoodEstimated Value: $804,000 - $861,000
4
Beds
4
Baths
3,004
Sq Ft
$276/Sq Ft
Est. Value
About This Home
This home is located at 1959 Old Byre Way, Apex, NC 27502 and is currently estimated at $828,206, approximately $275 per square foot. 1959 Old Byre Way is a home located in Wake County with nearby schools including Scotts Ridge Elementary School, Apex Friendship Middle School, and Apex Friendship High School.
Ownership History
Date
Name
Owned For
Owner Type
Purchase Details
Closed on
Nov 21, 2023
Sold by
Standifer Charles C and Standifer Jessica L
Bought by
Standifer Living Trust and Standifer
Current Estimated Value
Purchase Details
Closed on
Dec 14, 2012
Sold by
Royal Oaks Building Group Llc
Bought by
Standifer Charles C and Standifer Jessica L
Home Financials for this Owner
Home Financials are based on the most recent Mortgage that was taken out on this home.
Original Mortgage
$348,930
Interest Rate
3.44%
Mortgage Type
New Conventional
Purchase Details
Closed on
May 17, 2012
Sold by
Hfp Investor Llc
Bought by
Royal Oaks Building Group Llc
Home Financials for this Owner
Home Financials are based on the most recent Mortgage that was taken out on this home.
Original Mortgage
$340,000
Interest Rate
4.01%
Mortgage Type
Construction
Purchase Details
Closed on
Oct 21, 2010
Sold by
Reliabuilt Llc
Bought by
Hfp Investor Llc
Create a Home Valuation Report for This Property
The Home Valuation Report is an in-depth analysis detailing your home's value as well as a comparison with similar homes in the area
Home Values in the Area
Average Home Value in this Area
Purchase History
| Date | Buyer | Sale Price | Title Company |
|---|---|---|---|
| Standifer Living Trust | -- | None Listed On Document | |
| Standifer Charles C | $367,500 | None Available | |
| Royal Oaks Building Group Llc | $153,000 | None Available | |
| Hfp Investor Llc | -- | None Available | |
| Reliabuilt Llc | $3,524,968 | None Available |
Source: Public Records
Mortgage History
| Date | Status | Borrower | Loan Amount |
|---|---|---|---|
| Previous Owner | Standifer Charles C | $348,930 | |
| Previous Owner | Royal Oaks Building Group Llc | $340,000 | |
| Previous Owner | Royal Oaks Building Group Llc | $280,000 |
Source: Public Records
Tax History Compared to Growth
Tax History
| Year | Tax Paid | Tax Assessment Tax Assessment Total Assessment is a certain percentage of the fair market value that is determined by local assessors to be the total taxable value of land and additions on the property. | Land | Improvement |
|---|---|---|---|---|
| 2025 | $6,913 | $789,535 | $170,000 | $619,535 |
| 2024 | $6,759 | $789,535 | $170,000 | $619,535 |
| 2023 | $5,178 | $470,205 | $105,000 | $365,205 |
| 2022 | $4,861 | $470,205 | $105,000 | $365,205 |
| 2021 | $4,675 | $470,205 | $105,000 | $365,205 |
| 2020 | $4,628 | $470,205 | $105,000 | $365,205 |
| 2019 | $4,839 | $424,352 | $105,000 | $319,352 |
| 2018 | $4,558 | $424,352 | $105,000 | $319,352 |
| 2017 | $4,242 | $424,352 | $105,000 | $319,352 |
| 2016 | $4,181 | $424,352 | $105,000 | $319,352 |
| 2015 | $4,209 | $417,031 | $78,000 | $339,031 |
| 2014 | -- | $417,031 | $78,000 | $339,031 |
Source: Public Records
Map
Nearby Homes
- 1952 Combine Cir
- 2805 Evans Rd
- 1897 Lazio Ln
- 7104 Camp Branch Ln
- 1956 Lazio Ln
- 2048 Lazio Ln
- 1126 Woodlands Creek Way
- 1124 Woodlands Creek Way
- 2908 Evans Rd
- 2170 Vittorio Ln
- 2428 Vetrina Way
- 2429 Vetrina Way
- 2437 Vetrina Way
- 2499 Vetrina Way
- 2495 Vetrina Way
- 2511 Vetrina Way
- 2505 Vetrina Way
- Elizabeth Plan at Friendship Village - Single-Family
- Dillon Plan at Friendship Village - Single-Family
- Alexander Plan at Friendship Village - Single-Family
- 1963 Old Byre Way
- 1953 Old Byre Way
- 1948 Combine Cir
- 1960 Old Byre Way
- 1944 Combine Cir
- 1969 Old Byre Way
- 1956 Old Byre Way
- 1945 Old Byre Way
- 1956 Combine Cir
- 1968 Old Byre Way
- 1952 Old Byre Way
- 1940 Combine Cir
- 1977 Old Byre Way
- 1948 Old Byre Way
- 1955 Combine Cir
- 1939 Old Byre Way
- 1947 Combine Cir
- 1960 Combine Cir
- 1972 Old Byre Way
- 1936 Combine Cir