Estimated Value: $268,000 - $322,000
--
Bed
2
Baths
1,800
Sq Ft
$166/Sq Ft
Est. Value
About This Home
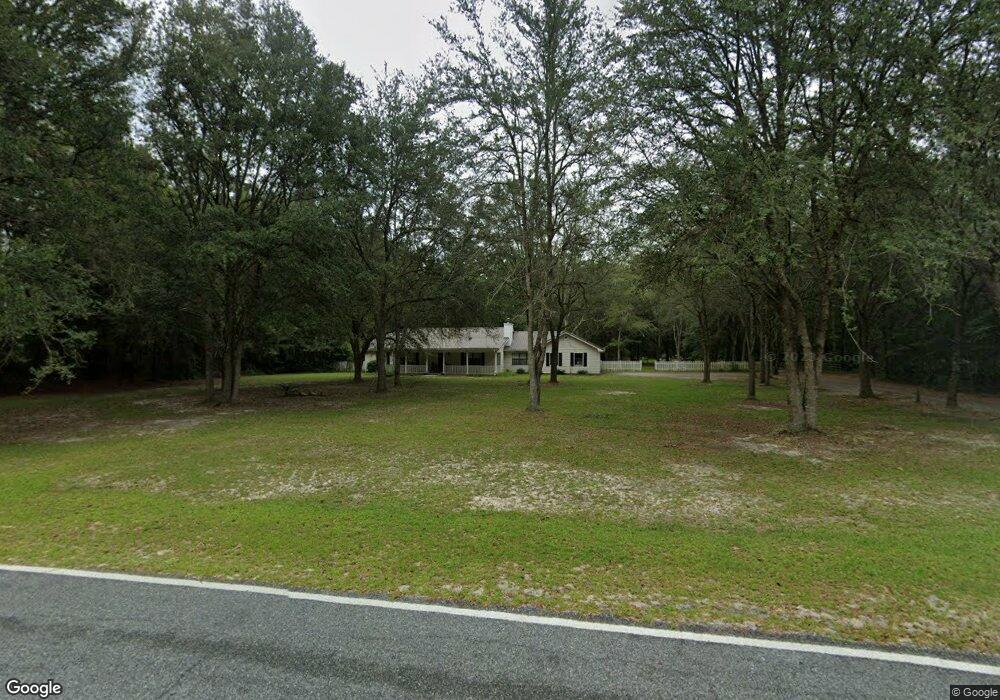
This home is located at 196 Big Oak Rd, Jesup, GA 31545 and is currently estimated at $299,317, approximately $166 per square foot. 196 Big Oak Rd is a home located in Wayne County with nearby schools including Bacon Elementary School, Martha Puckett Middle School, and Wayne County High School.
Ownership History
Date
Name
Owned For
Owner Type
Purchase Details
Closed on
Apr 5, 2022
Sold by
Ryan Thomas L
Bought by
Pye Douglas A and Pye Tiffany G
Current Estimated Value
Home Financials for this Owner
Home Financials are based on the most recent Mortgage that was taken out on this home.
Original Mortgage
$199,000
Outstanding Balance
$186,201
Interest Rate
3.89%
Mortgage Type
New Conventional
Estimated Equity
$113,116
Purchase Details
Closed on
Apr 1, 2003
Sold by
Steinbrecher Wallace E and Steinbrecher Tamra J
Bought by
Ryan Thomas L
Purchase Details
Closed on
Mar 1, 2001
Bought by
Steinbrecher Wallace E and Steinbrecher Tamra J
Purchase Details
Closed on
Sep 1, 1996
Purchase Details
Closed on
Jul 1, 1995
Purchase Details
Closed on
Sep 1, 1993
Purchase Details
Closed on
Feb 1, 1993
Purchase Details
Closed on
Sep 1, 1990
Create a Home Valuation Report for This Property
The Home Valuation Report is an in-depth analysis detailing your home's value as well as a comparison with similar homes in the area
Home Values in the Area
Average Home Value in this Area
Purchase History
| Date | Buyer | Sale Price | Title Company |
|---|---|---|---|
| Pye Douglas A | $249,000 | -- | |
| Ryan Thomas L | $140,000 | -- | |
| Steinbrecher Wallace E | $109,000 | -- | |
| -- | -- | -- | |
| -- | $95,000 | -- | |
| -- | -- | -- | |
| -- | $13,000 | -- | |
| -- | $8,700 | -- |
Source: Public Records
Mortgage History
| Date | Status | Borrower | Loan Amount |
|---|---|---|---|
| Open | Pye Douglas A | $199,000 |
Source: Public Records
Tax History Compared to Growth
Tax History
| Year | Tax Paid | Tax Assessment Tax Assessment Total Assessment is a certain percentage of the fair market value that is determined by local assessors to be the total taxable value of land and additions on the property. | Land | Improvement |
|---|---|---|---|---|
| 2024 | $2,685 | $106,340 | $13,856 | $92,484 |
| 2023 | $2,865 | $95,499 | $13,856 | $81,643 |
| 2022 | $1,956 | $67,117 | $13,856 | $53,261 |
| 2021 | $2,095 | $67,117 | $13,856 | $53,261 |
| 2020 | $2,167 | $67,117 | $13,856 | $53,261 |
| 2019 | $2,231 | $67,117 | $13,856 | $53,261 |
| 2018 | $2,231 | $67,117 | $13,856 | $53,261 |
| 2017 | $1,921 | $67,117 | $13,856 | $53,261 |
| 2016 | $1,859 | $67,117 | $13,856 | $53,261 |
| 2014 | $1,864 | $67,117 | $13,856 | $53,261 |
| 2013 | -- | $67,117 | $13,856 | $53,261 |
Source: Public Records
Map
Nearby Homes
- 440 Oak Island Estates Rd
- 177 Bunion Rd
- 15 Paris Dr
- 308 Cowboy Rd
- 0000 Spring Grove Rd
- 1276 Spring Grove Rd
- na Georgia 169
- 695 Lanes Bridge Rd
- 695 Lanes Bridge
- 75 Woodlawn Dr
- 95 Mayflower Rd
- 98 Saint Simons St
- 0 Red Oak Dr Unit 160341
- 0 Red Oak Dr Unit SA331365
- 1 Palm Island Cir
- 0 Palm Island Cir
- 721 Cowboy Rd
- 31 Boardwalk Ave
- 141 Boardwalk Ave
- 67 Boardwalk Ave
- 256 Big Oak Rd
- 148 Big Oak Rd
- 225 Big Oak Rd
- 0 Northshore Ave Unit 160623
- 0 Northshore Ave Unit 1654113
- 0 Northshore Ave Unit 8829727
- 0 Northshore Ave
- 133 Big Oak Rd
- 341 Ski Lake Dr
- 70 Big Oak Rd
- 419 Ski Lake Dr
- 0 Big Oak Rd
- 5 Oak Island Dr
- 469 Ski Lake Dr
- 49 Trk 1 Pb 45-153ll Trk 1
- 240 Oak Island Estates Rd
- 513 Ski Lake Dr
- 360 Oak Island Estates Rd
- 311 Oak Island Dr
- 361 Oak Island Estates Rd