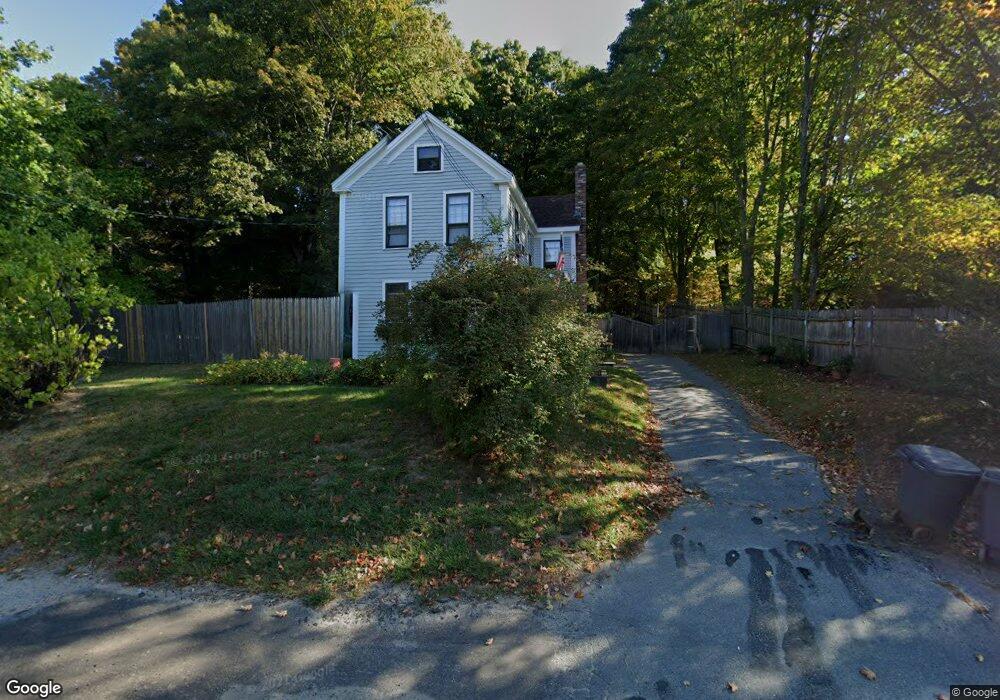
196 E Main St Georgetown, MA 01833
Estimated Value: $580,000 - $769,000
3
Beds
2
Baths
1,730
Sq Ft
$376/Sq Ft
Est. Value
About This Home
This home is located at 196 E Main St, Georgetown, MA 01833 and is currently estimated at $649,794, approximately $375 per square foot. 196 E Main St is a home located in Essex County with nearby schools including Perley Elementary School, Penn Brook School, and Georgetown High School.
Ownership History
Date
Name
Owned For
Owner Type
Purchase Details
Closed on
Aug 31, 2000
Sold by
Perkins Walter J and Argento-Perkins Maria
Bought by
Sexton Sean and Eggleston Paula M
Current Estimated Value
Purchase Details
Closed on
Jun 11, 1993
Sold by
Kennefick Donald P and Kennefick Mary Lee
Bought by
Perkins Walter J and Argento Maria H
Create a Home Valuation Report for This Property
The Home Valuation Report is an in-depth analysis detailing your home's value as well as a comparison with similar homes in the area
Home Values in the Area
Average Home Value in this Area
Purchase History
| Date | Buyer | Sale Price | Title Company |
|---|---|---|---|
| Sexton Sean | $244,900 | -- | |
| Perkins Walter J | $139,000 | -- |
Source: Public Records
Mortgage History
| Date | Status | Borrower | Loan Amount |
|---|---|---|---|
| Open | Perkins Walter J | $65,000 | |
| Open | Perkins Walter J | $315,200 | |
| Closed | Perkins Walter J | $59,000 | |
| Closed | Perkins Walter J | $231,000 |
Source: Public Records
Tax History
| Year | Tax Paid | Tax Assessment Tax Assessment Total Assessment is a certain percentage of the fair market value that is determined by local assessors to be the total taxable value of land and additions on the property. | Land | Improvement |
|---|---|---|---|---|
| 2025 | $6,169 | $557,800 | $275,900 | $281,900 |
| 2024 | $5,089 | $405,500 | $193,900 | $211,600 |
| 2023 | $5,175 | $398,700 | $193,900 | $204,800 |
| 2022 | $5,256 | $373,300 | $168,500 | $204,800 |
| 2021 | $4,932 | $310,400 | $168,500 | $141,900 |
| 2020 | $4,942 | $310,400 | $168,500 | $141,900 |
| 2019 | $4,745 | $300,700 | $165,200 | $135,500 |
| 2018 | $4,775 | $300,700 | $165,200 | $135,500 |
| 2017 | $4,790 | $295,500 | $165,200 | $130,300 |
| 2016 | $4,447 | $280,200 | $165,200 | $115,000 |
| 2015 | $4,487 | $279,900 | $165,200 | $114,700 |
| 2014 | $3,933 | $279,900 | $165,200 | $114,700 |
Source: Public Records
Map
Nearby Homes
Your Personal Tour Guide
Ask me questions while you tour the home.