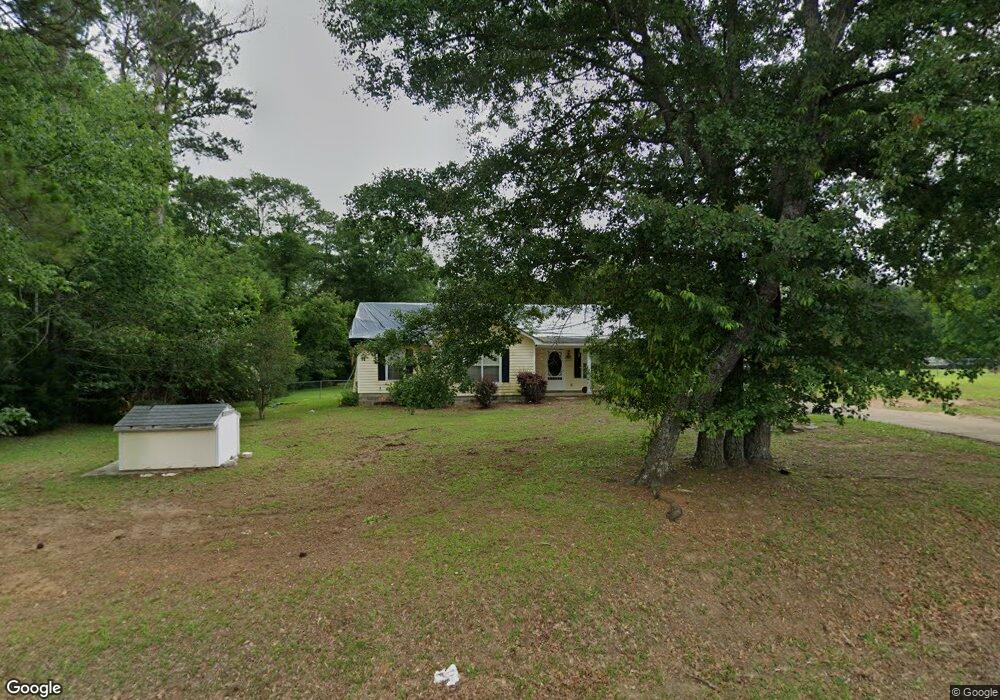
196 Firetower Rd Leesburg, GA 31763
Estimated Value: $386,000 - $523,000
3
Beds
3
Baths
2,871
Sq Ft
$160/Sq Ft
Est. Value
About This Home
This home is located at 196 Firetower Rd, Leesburg, GA 31763 and is currently estimated at $460,646, approximately $160 per square foot. 196 Firetower Rd is a home located in Lee County with nearby schools including Kinchafoonee Primary School, Twin Oaks Elementary School, and Lee County Middle School East.
Ownership History
Date
Name
Owned For
Owner Type
Purchase Details
Closed on
Sep 19, 2013
Sold by
Rowell Ronnie J and Rowell Betty B
Bought by
Rowell Ronnie J and Rowell Betty B
Current Estimated Value
Home Financials for this Owner
Home Financials are based on the most recent Mortgage that was taken out on this home.
Original Mortgage
$117,142
Outstanding Balance
$82,351
Interest Rate
3%
Mortgage Type
VA
Estimated Equity
$378,295
Purchase Details
Closed on
Jul 17, 2013
Sold by
Marshall Harris P
Bought by
Rowell Ronnie J and Rowell Betty B
Home Financials for this Owner
Home Financials are based on the most recent Mortgage that was taken out on this home.
Original Mortgage
$110,832
Interest Rate
3.96%
Mortgage Type
New Conventional
Purchase Details
Closed on
Feb 29, 1996
Sold by
Triton Group Inc
Bought by
Marshall Harris P
Purchase Details
Closed on
Jun 29, 1995
Sold by
Allen Nora M
Bought by
Triton Group Inc
Create a Home Valuation Report for This Property
The Home Valuation Report is an in-depth analysis detailing your home's value as well as a comparison with similar homes in the area
Home Values in the Area
Average Home Value in this Area
Purchase History
| Date | Buyer | Sale Price | Title Company |
|---|---|---|---|
| Rowell Ronnie J | -- | -- | |
| Rowell Ronnie J | $108,500 | -- | |
| Marshall Harris P | $74,000 | -- | |
| Triton Group Inc | $29,100 | -- |
Source: Public Records
Mortgage History
| Date | Status | Borrower | Loan Amount |
|---|---|---|---|
| Open | Rowell Ronnie J | $117,142 | |
| Previous Owner | Rowell Ronnie J | $110,832 |
Source: Public Records
Tax History Compared to Growth
Tax History
| Year | Tax Paid | Tax Assessment Tax Assessment Total Assessment is a certain percentage of the fair market value that is determined by local assessors to be the total taxable value of land and additions on the property. | Land | Improvement |
|---|---|---|---|---|
| 2024 | $5,014 | $143,760 | $20,000 | $123,760 |
| 2023 | $4,722 | $143,760 | $20,000 | $123,760 |
| 2022 | $3,912 | $138,840 | $20,000 | $118,840 |
| 2021 | $1,279 | $45,320 | $8,000 | $37,320 |
| 2020 | $1,293 | $39,080 | $7,480 | $31,600 |
| 2019 | $3,825 | $39,080 | $7,480 | $31,600 |
| 2018 | $1,295 | $38,424 | $7,480 | $30,944 |
| 2017 | $1,226 | $38,424 | $7,480 | $30,944 |
| 2016 | $1,226 | $38,424 | $7,480 | $30,944 |
| 2015 | $1,233 | $38,424 | $7,480 | $30,944 |
| 2014 | $1,237 | $38,424 | $7,480 | $30,944 |
| 2013 | -- | $38,424 | $7,480 | $30,944 |
Source: Public Records
Map
Nearby Homes
- 102 Sautee Ct
- 258 Fire Tower Rd
- 182 Canal St
- 102 Society St
- 201 Groover St
- 178 Old Stage Rd
- 134 Brookfair Ln
- 154 Morgan Farm Rd
- 143 Tallassee Trail
- 249 Morgan Farm Dr
- 134 Danville Dr
- 1564 State Hwy 32w
- 1591 E US Hwy 32
- 118 Blue Springs Dr
- 98 Senah Dr
- 105 Fortner Ct
- 152 Senah Dr
- 159 Senah Dr
- 163 Northwood Dr
- 127 Northwood Dr
- 190 Firetower Rd
- 184 Firetower Rd
- 187 Society St
- 172 Firetower Rd
- 200 Firetower Rd
- 181 Society St
- 167 Firetower Rd
- 220 Firetower Rd
- 177 Society St
- 223 Firetower Rd
- 163 Firetower Rd
- 256 Canal St
- 160 Firetower Rd
- 252 Canal St
- 226 Firetower Rd
- 227 Firetower Rd
- 248 Canal St
- 169 Society St
- 230 Firetower Rd
- 157 Firetower Rd