
R
Landlord's Agent in 2023
Roxanne Sarotic
eXp Realty
(339) 208-4708
6 Total Sales
Estimated Value: $1,045,000 - $1,271,000
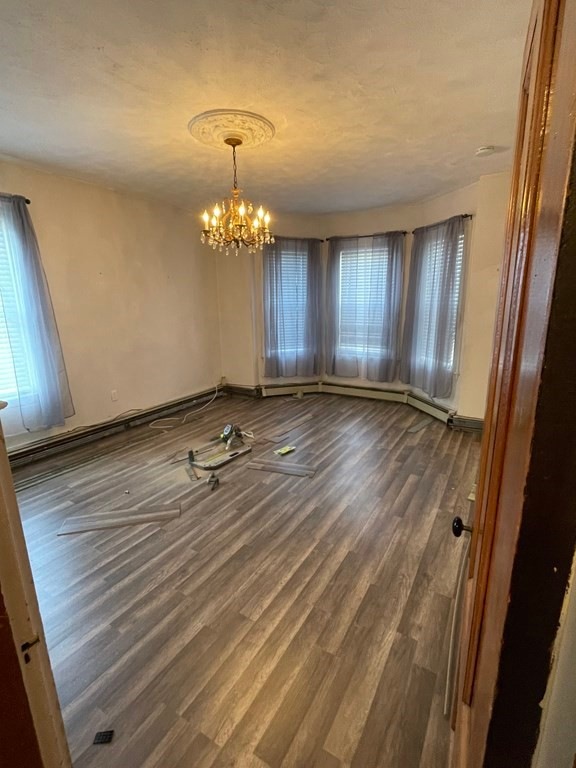
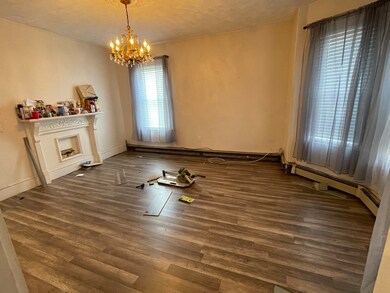
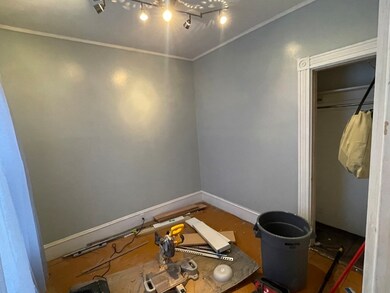
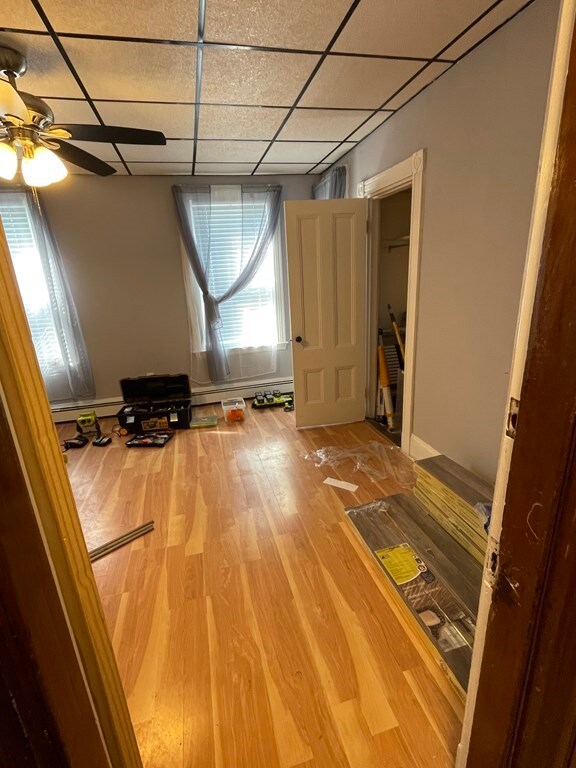
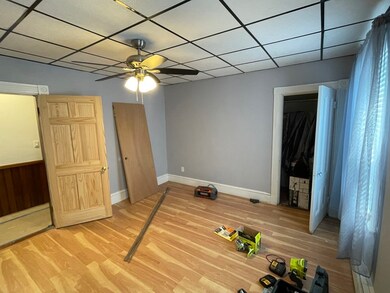
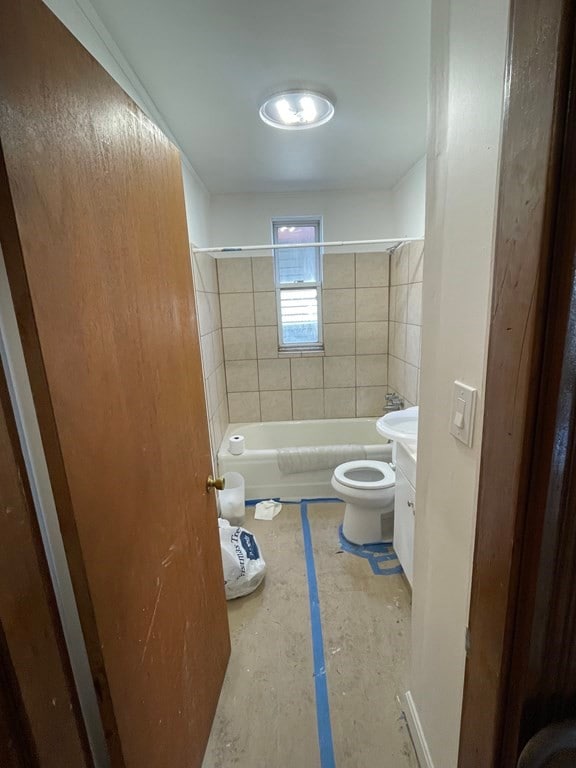
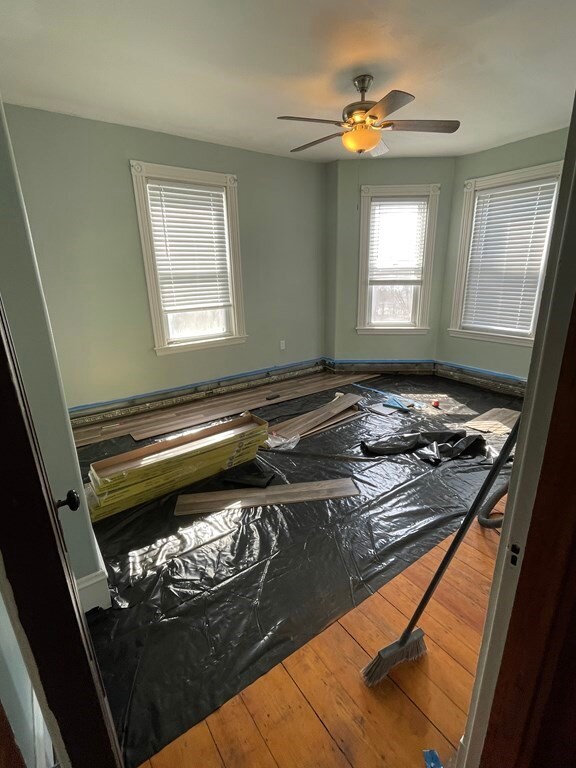
Beautiful 3rd floor unit in Roxbury. 2 LARGE spacious bedrooms with lots of natural light in a well maintained family house. BONUS ROOM!! Could be used as a 3rd bedroom, office space or anything you'd like! The huge master bedroom features 2 closets! Lots of living room space. Eat in kitchen comes equipped with stainless steel appliances and a microwave. Hardwood floors throughout this amazing spacious unit. Porch/ outdoor space makes for lovely views and fresh air! This unit is vacant and easy to show! Some notice required.
| Date | Event | Price | List to Sale | Price per Sq Ft |
|---|---|---|---|---|
| 04/03/2023 04/03/23 | Rented | $3,000 | -9.1% | -- |
| 03/03/2023 03/03/23 | For Rent | $3,300 | -- | -- |
| Year | Tax Paid | Tax Assessment Tax Assessment Total Assessment is a certain percentage of the fair market value that is determined by local assessors to be the total taxable value of land and additions on the property. | Land | Improvement |
|---|---|---|---|---|
| 2025 | $11,963 | $1,033,100 | $323,300 | $709,800 |
| 2024 | $10,574 | $970,100 | $199,000 | $771,100 |
| 2023 | $9,923 | $923,900 | $189,500 | $734,400 |
| 2022 | $9,758 | $896,900 | $184,000 | $712,900 |
| 2021 | $9,291 | $870,800 | $178,600 | $692,200 |
| 2020 | $7,479 | $708,200 | $181,100 | $527,100 |
| 2019 | $6,664 | $632,300 | $130,200 | $502,100 |
| 2018 | $6,136 | $585,500 | $130,200 | $455,300 |
| 2017 | $6,200 | $585,500 | $130,200 | $455,300 |
| 2016 | $5,015 | $455,868 | $109,368 | $346,500 |
| 2015 | $4,745 | $391,800 | $105,300 | $286,500 |
| 2014 | $4,481 | $356,200 | $105,300 | $250,900 |
R
Landlord's Agent in 2023
Roxanne Sarotic
eXp Realty
(339) 208-4708
6 Total Sales
Source: MLS Property Information Network (MLS PIN)
MLS Number: 73083905
APN: ROXB-000000-000011-000477
Disclaimer: Certain information contained herein is derived from information provided by parties other than Homes.com. All information provided is deemed reliable, but is not guaranteed to be accurate and should be independently verified.
![]() The property listing data and information, or the Images, set forth herein were provided to MLS Property Information Network, Inc. from third party sources, including sellers, lessors and public records, and were compiled by MLS Property Information Network, Inc. The property listing data and information, and the Images, are for the personal, non-commercial use of consumers having a good faith interest in purchasing or leasing listed properties of the type displayed to them and may not be used for any purpose other than to identify prospective properties which such consumers may have a good faith interest in purchasing or leasing. MLS Property Information Network, Inc. and its subscribers disclaim any and all representations and warranties as to the accuracy of the property listing data and information, or as to the accuracy of any of the Images, set forth herein.
The property listing data and information, or the Images, set forth herein were provided to MLS Property Information Network, Inc. from third party sources, including sellers, lessors and public records, and were compiled by MLS Property Information Network, Inc. The property listing data and information, and the Images, are for the personal, non-commercial use of consumers having a good faith interest in purchasing or leasing listed properties of the type displayed to them and may not be used for any purpose other than to identify prospective properties which such consumers may have a good faith interest in purchasing or leasing. MLS Property Information Network, Inc. and its subscribers disclaim any and all representations and warranties as to the accuracy of the property listing data and information, or as to the accuracy of any of the Images, set forth herein.