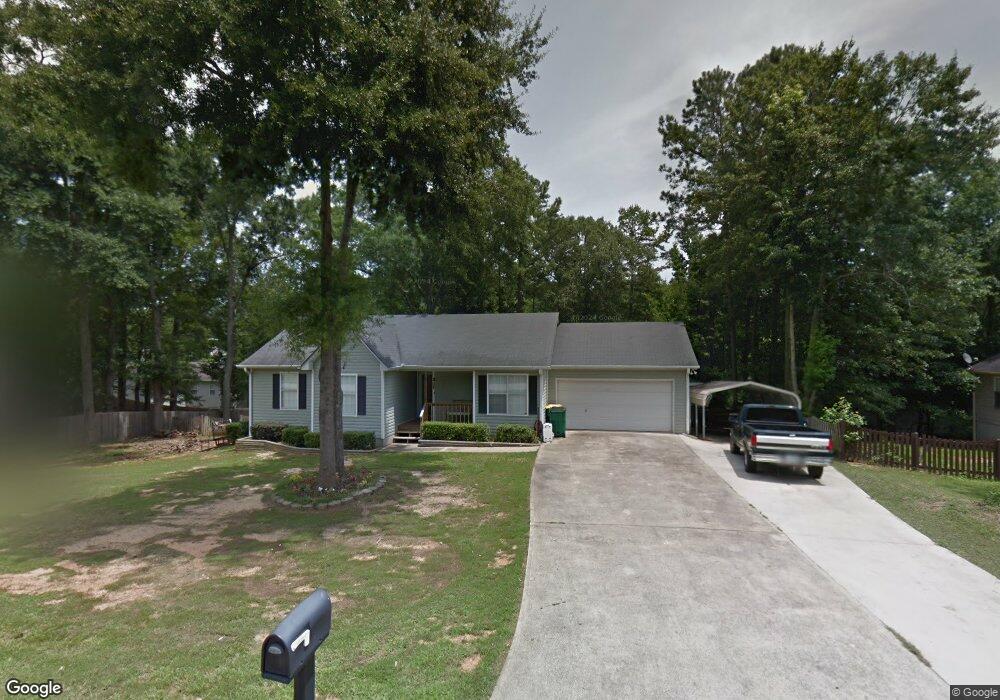
196 Macey Way Winder, GA 30680
Estimated Value: $257,000 - $301,098
3
Beds
2
Baths
1,227
Sq Ft
$224/Sq Ft
Est. Value
About This Home
This home is located at 196 Macey Way, Winder, GA 30680 and is currently estimated at $274,525, approximately $223 per square foot. 196 Macey Way is a home located in Barrow County with nearby schools including Holsenbeck Elementary School, Bear Creek Middle School, and Winder-Barrow High School.
Ownership History
Date
Name
Owned For
Owner Type
Purchase Details
Closed on
Apr 6, 2020
Sold by
Barnes Vann Estate
Bought by
Mcguire Evonne
Current Estimated Value
Home Financials for this Owner
Home Financials are based on the most recent Mortgage that was taken out on this home.
Original Mortgage
$121,754
Outstanding Balance
$108,062
Interest Rate
3.5%
Mortgage Type
FHA
Estimated Equity
$166,463
Purchase Details
Closed on
Aug 5, 2010
Sold by
Deutsche Bk Nat Trust 2006-1
Bought by
Barnes Vann
Purchase Details
Closed on
May 4, 2010
Sold by
Chapman William
Bought by
Deutsche Bk Natl Trust Trust 2
Purchase Details
Closed on
Apr 19, 2002
Sold by
Weatherly Robert C and Weatherly Rebecca K
Bought by
Chapman Willoaim
Purchase Details
Closed on
Jul 31, 1997
Sold by
Pentrust Homes
Bought by
Weatherly Rbt C
Home Financials for this Owner
Home Financials are based on the most recent Mortgage that was taken out on this home.
Original Mortgage
$82,300
Interest Rate
7.61%
Mortgage Type
FHA
Create a Home Valuation Report for This Property
The Home Valuation Report is an in-depth analysis detailing your home's value as well as a comparison with similar homes in the area
Home Values in the Area
Average Home Value in this Area
Purchase History
| Date | Buyer | Sale Price | Title Company |
|---|---|---|---|
| Mcguire Evonne | $124,000 | -- | |
| Barnes Vann | $56,000 | -- | |
| Deutsche Bk Natl Trust Trust 2 | $54,000 | -- | |
| Chapman Willoaim | $106,000 | -- | |
| Weatherly Rbt C | $81,900 | -- |
Source: Public Records
Mortgage History
| Date | Status | Borrower | Loan Amount |
|---|---|---|---|
| Open | Mcguire Evonne | $121,754 | |
| Previous Owner | Weatherly Rbt C | $82,300 |
Source: Public Records
Tax History Compared to Growth
Tax History
| Year | Tax Paid | Tax Assessment Tax Assessment Total Assessment is a certain percentage of the fair market value that is determined by local assessors to be the total taxable value of land and additions on the property. | Land | Improvement |
|---|---|---|---|---|
| 2024 | $2,216 | $77,836 | $20,000 | $57,836 |
| 2023 | $2,209 | $77,836 | $20,000 | $57,836 |
| 2022 | $2,079 | $60,068 | $16,400 | $43,668 |
| 2021 | $2,053 | $55,668 | $12,000 | $43,668 |
| 2020 | $1,821 | $51,462 | $12,000 | $39,462 |
| 2019 | $1,752 | $48,657 | $12,000 | $36,657 |
| 2018 | $663 | $42,318 | $10,000 | $32,318 |
| 2017 | $1,009 | $33,831 | $9,000 | $24,831 |
| 2016 | $885 | $29,880 | $8,000 | $21,880 |
| 2015 | $903 | $30,402 | $8,000 | $22,402 |
| 2014 | $840 | $29,286 | $5,488 | $23,798 |
| 2013 | -- | $28,144 | $5,488 | $22,656 |
Source: Public Records
Map
Nearby Homes
- 200 Macey Way Unit 1
- 0 Macey Way
- 190 Macey Way
- 305 Mary Alice Dr Unit 1
- 265 King St
- 265 King St Unit 1
- 195 Macey Way Unit 1
- 197 Macey Way
- 303 Mary Alice Dr
- 201 Macey Way Unit 1
- 191 Macey Way
- 191 Macey Way Unit 1
- 267 Martin Luther King jr Dr
- 267 Martin Luther King jr Dr
- 308 Mary Alice Dr Unit 57
- 308 Mary Alice Dr
- 308 Mary Alice Dr Unit 1
- 241 Martin Luther King jr Dr
- 315 Mary Alice Dr
- 262 King St