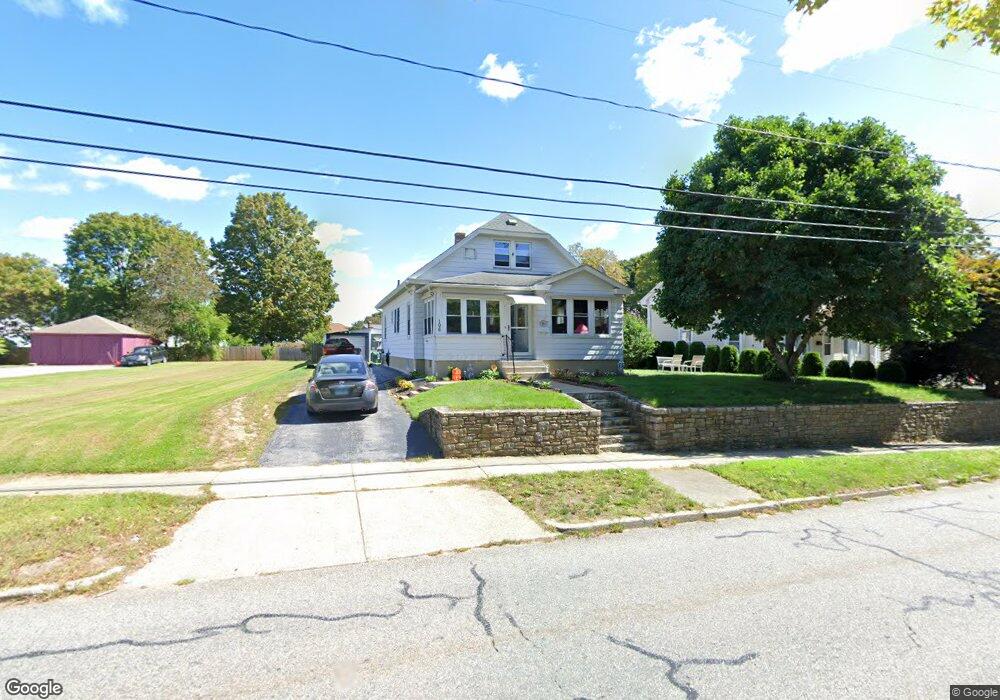
196 Maple St Danielson, CT 06239
Estimated Value: $252,294 - $285,000
2
Beds
1
Bath
1,148
Sq Ft
$236/Sq Ft
Est. Value
About This Home
This home is located at 196 Maple St, Danielson, CT 06239 and is currently estimated at $270,574, approximately $235 per square foot. 196 Maple St is a home located in Windham County with nearby schools including Killingly Central School, Killingly Memorial School, and Killingly Intermediate School.
Ownership History
Date
Name
Owned For
Owner Type
Purchase Details
Closed on
Apr 16, 2004
Sold by
Dpac Constr Llc
Bought by
Moninski Paul A
Current Estimated Value
Home Financials for this Owner
Home Financials are based on the most recent Mortgage that was taken out on this home.
Original Mortgage
$130,000
Interest Rate
5.58%
Purchase Details
Closed on
Dec 18, 2003
Sold by
J P Morgan Chase Bk
Bought by
Dpac Constr Llc
Purchase Details
Closed on
Oct 22, 2002
Sold by
Stonge Terry J
Bought by
Belville Jane
Purchase Details
Closed on
May 13, 1996
Sold by
Manso Paul and Manso Rita M
Bought by
Stonge Terry J
Create a Home Valuation Report for This Property
The Home Valuation Report is an in-depth analysis detailing your home's value as well as a comparison with similar homes in the area
Home Values in the Area
Average Home Value in this Area
Purchase History
| Date | Buyer | Sale Price | Title Company |
|---|---|---|---|
| Moninski Paul A | $150,000 | -- | |
| Moninski Paul A | $150,000 | -- | |
| Dpac Constr Llc | $100,000 | -- | |
| Dpac Constr Llc | $100,000 | -- | |
| Belville Jane | $116,600 | -- | |
| Stonge Terry J | $85,000 | -- | |
| Stonge Terry J | $85,000 | -- |
Source: Public Records
Mortgage History
| Date | Status | Borrower | Loan Amount |
|---|---|---|---|
| Open | Stonge Terry J | $147,103 | |
| Closed | Stonge Terry J | $25,000 | |
| Closed | Stonge Terry J | $130,000 |
Source: Public Records
Tax History
| Year | Tax Paid | Tax Assessment Tax Assessment Total Assessment is a certain percentage of the fair market value that is determined by local assessors to be the total taxable value of land and additions on the property. | Land | Improvement |
|---|---|---|---|---|
| 2025 | $3,239 | $129,290 | $26,630 | $102,660 |
| 2024 | $3,092 | $129,290 | $26,630 | $102,660 |
| 2023 | $3,221 | $100,380 | $21,970 | $78,410 |
| 2022 | $3,030 | $100,380 | $21,970 | $78,410 |
| 2021 | $3,064 | $101,500 | $21,980 | $79,520 |
| 2020 | $3,014 | $101,500 | $21,980 | $79,520 |
| 2019 | $3,046 | $101,500 | $21,980 | $79,520 |
| 2017 | $2,543 | $78,820 | $14,000 | $64,820 |
| 2016 | $2,543 | $78,820 | $14,000 | $64,820 |
| 2015 | $2,492 | $78,820 | $14,000 | $64,820 |
| 2014 | $2,432 | $78,820 | $14,000 | $64,820 |
Source: Public Records
Map
Nearby Homes
Your Personal Tour Guide
Ask me questions while you tour the home.