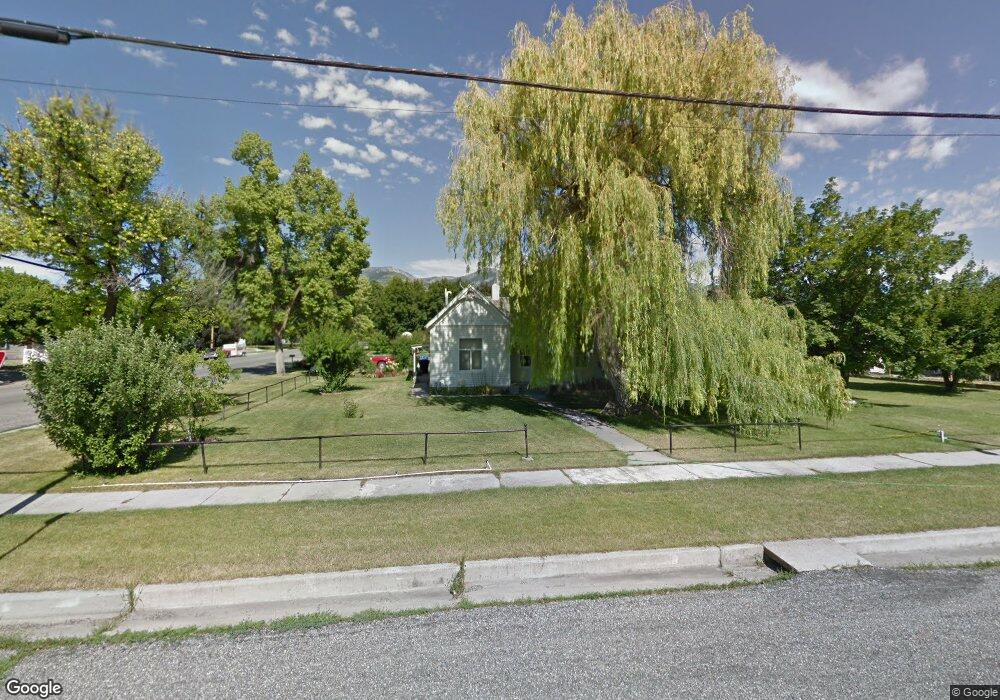
196 N 100 E Smithfield, UT 84335
Estimated Value: $275,111 - $340,000
2
Beds
1
Bath
1,022
Sq Ft
$301/Sq Ft
Est. Value
About This Home
This home is located at 196 N 100 E, Smithfield, UT 84335 and is currently estimated at $307,528, approximately $300 per square foot. 196 N 100 E is a home located in Cache County with nearby schools including Summit School, North Cache Middle School, and White Pine Middle School.
Ownership History
Date
Name
Owned For
Owner Type
Purchase Details
Closed on
Jul 7, 2018
Sold by
Rosales Juan A
Bought by
Rosales Martha Alicia Monterrosa De and Cook Karen De Los Angeles
Current Estimated Value
Purchase Details
Closed on
Sep 8, 2005
Sold by
Haynes Barbara L
Bought by
Rosales Juan A
Home Financials for this Owner
Home Financials are based on the most recent Mortgage that was taken out on this home.
Original Mortgage
$100,424
Outstanding Balance
$52,890
Interest Rate
5.7%
Mortgage Type
FHA
Estimated Equity
$254,638
Create a Home Valuation Report for This Property
The Home Valuation Report is an in-depth analysis detailing your home's value as well as a comparison with similar homes in the area
Home Values in the Area
Average Home Value in this Area
Purchase History
| Date | Buyer | Sale Price | Title Company |
|---|---|---|---|
| Rosales Martha Alicia Monterrosa De | -- | Accommodation | |
| Rosales Juan A | -- | Advanced Title Co |
Source: Public Records
Mortgage History
| Date | Status | Borrower | Loan Amount |
|---|---|---|---|
| Open | Rosales Juan A | $100,424 |
Source: Public Records
Tax History
| Year | Tax Paid | Tax Assessment Tax Assessment Total Assessment is a certain percentage of the fair market value that is determined by local assessors to be the total taxable value of land and additions on the property. | Land | Improvement |
|---|---|---|---|---|
| 2025 | $1,102 | $147,530 | $0 | $0 |
| 2024 | $129 | $162,150 | $0 | $0 |
| 2023 | $1,364 | $162,020 | $0 | $0 |
| 2022 | $1,307 | $152,740 | $0 | $0 |
| 2021 | $1,223 | $218,366 | $70,000 | $148,366 |
| 2020 | $1,106 | $184,128 | $70,000 | $114,128 |
| 2019 | $1,002 | $159,128 | $45,000 | $114,128 |
| 2018 | $957 | $146,900 | $45,000 | $101,900 |
| 2017 | $717 | $60,170 | $0 | $0 |
| 2016 | $730 | $60,170 | $0 | $0 |
| 2015 | $733 | $60,170 | $0 | $0 |
| 2014 | $719 | $60,170 | $0 | $0 |
| 2013 | -- | $60,170 | $0 | $0 |
Source: Public Records
Map
Nearby Homes
Your Personal Tour Guide
Ask me questions while you tour the home.