Estimated Value: $617,000 - $870,000
2
Beds
3
Baths
4,397
Sq Ft
$174/Sq Ft
Est. Value
About This Home
This home is located at 196 N 840 E, Declo, ID 83323 and is currently estimated at $765,848, approximately $174 per square foot. 196 N 840 E is a home located in Cassia County with nearby schools including Declo Elementary School, Declo Junior High School, and Declo Senior High School.
Ownership History
Date
Name
Owned For
Owner Type
Purchase Details
Closed on
Mar 17, 2009
Sold by
Newman Ryan and Newman Noree
Bought by
Harper Gary B and Harper Susan C
Current Estimated Value
Purchase Details
Closed on
Mar 31, 2008
Sold by
Bagwell Wayne R and Bagwell Leeanna J
Bought by
Newman Ryan and Newman Noree
Home Financials for this Owner
Home Financials are based on the most recent Mortgage that was taken out on this home.
Original Mortgage
$310,000
Interest Rate
5.72%
Mortgage Type
Purchase Money Mortgage
Create a Home Valuation Report for This Property
The Home Valuation Report is an in-depth analysis detailing your home's value as well as a comparison with similar homes in the area
Purchase History
| Date | Buyer | Sale Price | Title Company |
|---|---|---|---|
| Harper Gary B | -- | Land Title And Escrow | |
| Newman Ryan | -- | Land Title & Escrow |
Source: Public Records
Mortgage History
| Date | Status | Borrower | Loan Amount |
|---|---|---|---|
| Previous Owner | Newman Ryan | $310,000 |
Source: Public Records
Tax History
| Year | Tax Paid | Tax Assessment Tax Assessment Total Assessment is a certain percentage of the fair market value that is determined by local assessors to be the total taxable value of land and additions on the property. | Land | Improvement |
|---|---|---|---|---|
| 2024 | $2,027 | $688,804 | $168,904 | $519,900 |
| 2023 | $3,174 | $725,211 | $168,904 | $556,307 |
| 2022 | $3,341 | $620,101 | $148,654 | $471,447 |
| 2021 | $3,203 | $521,511 | $125,670 | $395,841 |
| 2020 | $3,265 | $481,287 | $132,553 | $348,734 |
| 2019 | $3,177 | $465,144 | $126,564 | $338,580 |
| 2017 | $2,833 | $415,407 | $117,489 | $297,918 |
| 2016 | $2,807 | $405,043 | $117,489 | $287,554 |
| 2015 | $2,737 | $396,793 | $109,239 | $287,554 |
| 2014 | $2,757 | $396,793 | $109,239 | $287,554 |
| 2013 | $2,757 | $396,793 | $109,239 | $287,554 |
Source: Public Records
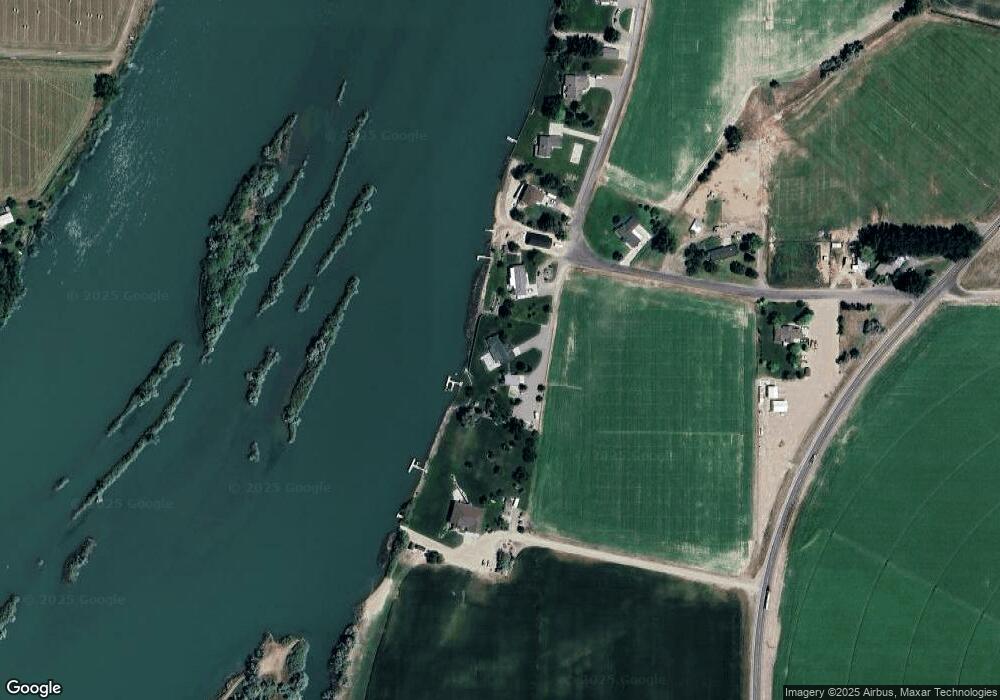
Map
Nearby Homes
Your Personal Tour Guide
Ask me questions while you tour the home.