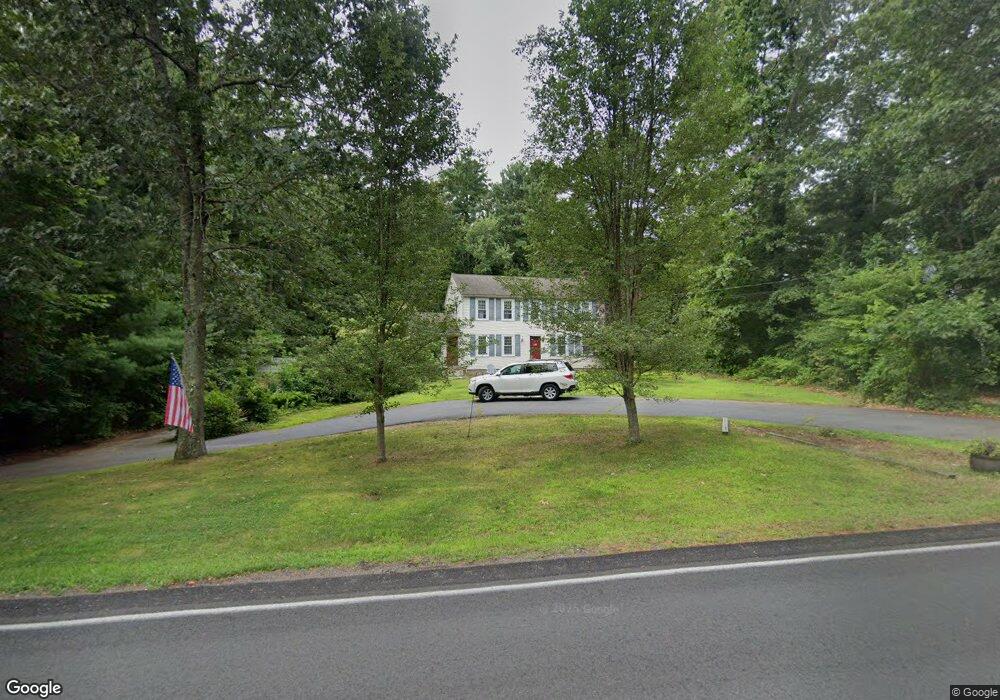
196 Oldham St Pembroke, MA 02359
Estimated Value: $647,876 - $747,000
4
Beds
2
Baths
1,896
Sq Ft
$367/Sq Ft
Est. Value
About This Home
This home is located at 196 Oldham St, Pembroke, MA 02359 and is currently estimated at $696,719, approximately $367 per square foot. 196 Oldham St is a home located in Plymouth County with nearby schools including Pembroke High School and Cardinal Cushing Centers.
Ownership History
Date
Name
Owned For
Owner Type
Purchase Details
Closed on
Sep 23, 2005
Sold by
Emond Michael A and Carter Kimberly A
Bought by
Lebarre Edward M
Current Estimated Value
Home Financials for this Owner
Home Financials are based on the most recent Mortgage that was taken out on this home.
Original Mortgage
$338,400
Interest Rate
5.92%
Mortgage Type
Purchase Money Mortgage
Purchase Details
Closed on
Feb 20, 2004
Sold by
Smith Brian P and Smith Jennifer A
Bought by
Emond Michael A and Carter Kimberly A
Purchase Details
Closed on
Apr 13, 2001
Sold by
Mcgonagle William J and Mcgonagle Karen May
Bought by
Smith Brian P and Smith Jennifer A
Create a Home Valuation Report for This Property
The Home Valuation Report is an in-depth analysis detailing your home's value as well as a comparison with similar homes in the area
Purchase History
| Date | Buyer | Sale Price | Title Company |
|---|---|---|---|
| Lebarre Edward M | $423,000 | -- | |
| Emond Michael A | $365,000 | -- | |
| Smith Brian P | $245,000 | -- |
Source: Public Records
Mortgage History
| Date | Status | Borrower | Loan Amount |
|---|---|---|---|
| Open | Smith Brian P | $341,625 | |
| Closed | Smith Brian P | $338,400 |
Source: Public Records
Tax History
| Year | Tax Paid | Tax Assessment Tax Assessment Total Assessment is a certain percentage of the fair market value that is determined by local assessors to be the total taxable value of land and additions on the property. | Land | Improvement |
|---|---|---|---|---|
| 2025 | $6,486 | $539,600 | $305,400 | $234,200 |
| 2024 | $6,406 | $532,500 | $300,200 | $232,300 |
| 2023 | $6,031 | $474,100 | $275,400 | $198,700 |
| 2022 | $5,745 | $406,000 | $230,100 | $175,900 |
| 2021 | $5,565 | $381,700 | $220,100 | $161,600 |
| 2020 | $5,418 | $373,900 | $215,300 | $158,600 |
| 2019 | $5,212 | $357,000 | $205,300 | $151,700 |
| 2018 | $4,973 | $334,000 | $200,100 | $133,900 |
| 2017 | $4,882 | $323,300 | $190,100 | $133,200 |
| 2016 | $4,763 | $312,100 | $177,700 | $134,400 |
| 2015 | $4,507 | $305,800 | $170,100 | $135,700 |
Source: Public Records
Map
Nearby Homes
- 66 Wildwood Rd
- 204 Center St Unit 9
- 269 Lakeside Rd
- 353 Cross St
- 134 Crescent St
- 285 W Elm St
- 177 Dwelley St
- 7 Farmside Dr
- 339 State St
- 60 Summer Path Way
- 10 Fir Rd
- 148 High St
- 78 Old Cart Path Ln Unit Lot 3
- 72 Old Cart Path Ln Unit Lot 2
- 77 Old Cart Path Ln Unit Lot 4
- 33 Barker Square Dr Unit 33
- 20 Montclair Ave
- 430 Brook Bend Rd
- 114 Graham Hill Dr
- 30 Old Washington St Unit 9
- 190 Oldham St
- 202 Oldham St
- 195 Oldham St
- 14 Wampatuck St
- 184 Oldham St
- 225 Oldham St
- 185 Oldham St
- 180 Oldham St
- 13 Wampatuck St
- 20 Wampatuck St
- 179 Oldham St
- 24 Wampatuck St
- 126 Wintergreen Farm Rd
- 175 Oldham St
- 23 Wampatuck St
- 239 Oldham St
- 0 W Elm St
- 28 Wampatuck St
- 34 Wampatuck St
- 234 Oldham St