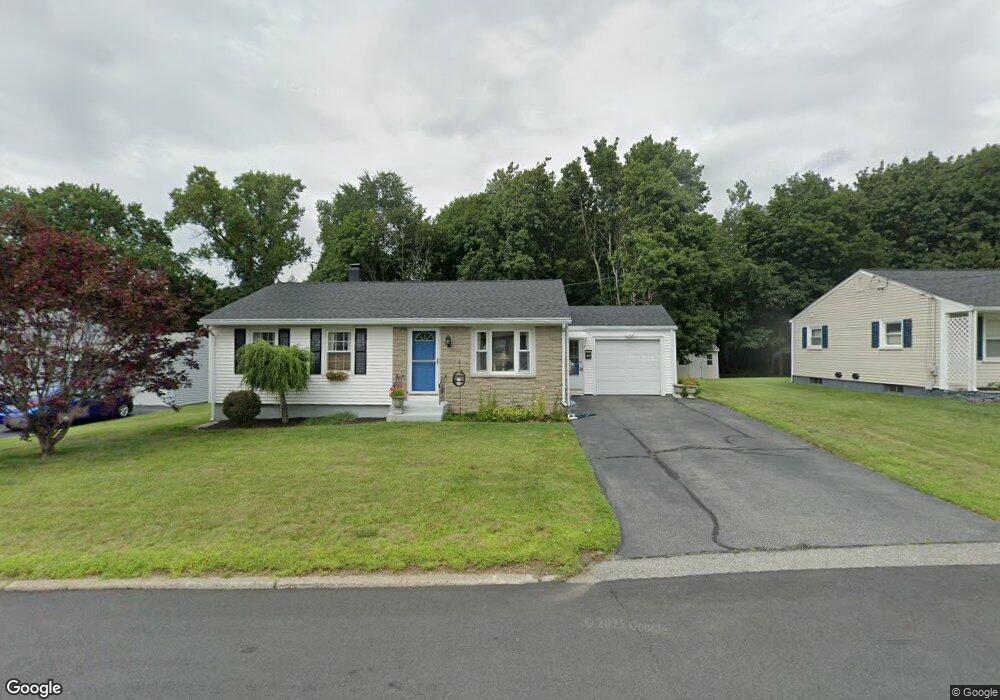
196 Patton Rd Woonsocket, RI 02895
East Woonsocket NeighborhoodEstimated Value: $367,861 - $387,000
3
Beds
1
Bath
1,020
Sq Ft
$372/Sq Ft
Est. Value
About This Home
This home is located at 196 Patton Rd, Woonsocket, RI 02895 and is currently estimated at $379,465, approximately $372 per square foot. 196 Patton Rd is a home located in Providence County with nearby schools including Woonsocket High School and Good Shepherd Catholic School.
Ownership History
Date
Name
Owned For
Owner Type
Purchase Details
Closed on
Mar 12, 2025
Sold by
Larson Frederick T and Larson Bonnie
Bought by
Larson Ft and Larson
Current Estimated Value
Purchase Details
Closed on
Oct 16, 2023
Sold by
Larson Frederick T and Larson Bonnie
Bought by
Larson Ft and Larson
Create a Home Valuation Report for This Property
The Home Valuation Report is an in-depth analysis detailing your home's value as well as a comparison with similar homes in the area
Home Values in the Area
Average Home Value in this Area
Purchase History
| Date | Buyer | Sale Price | Title Company |
|---|---|---|---|
| Larson Ft | -- | None Available | |
| Larson Ft | -- | None Available | |
| Larson Ft | -- | None Available | |
| Larson Ft | -- | None Available | |
| Larson Ft | -- | None Available | |
| Larson Ft | -- | None Available |
Source: Public Records
Tax History
| Year | Tax Paid | Tax Assessment Tax Assessment Total Assessment is a certain percentage of the fair market value that is determined by local assessors to be the total taxable value of land and additions on the property. | Land | Improvement |
|---|---|---|---|---|
| 2025 | $3,886 | $346,000 | $105,200 | $240,800 |
| 2024 | $3,581 | $246,300 | $85,800 | $160,500 |
| 2023 | $3,443 | $246,300 | $85,800 | $160,500 |
| 2022 | $3,443 | $246,300 | $85,800 | $160,500 |
| 2021 | $3,755 | $158,100 | $67,500 | $90,600 |
| 2020 | $3,794 | $158,100 | $67,500 | $90,600 |
| 2018 | $3,807 | $158,100 | $67,500 | $90,600 |
| 2017 | $4,256 | $141,400 | $63,700 | $77,700 |
| 2016 | $4,502 | $141,400 | $63,700 | $77,700 |
| 2015 | $5,172 | $141,400 | $63,700 | $77,700 |
| 2014 | $3,583 | $142,400 | $70,100 | $72,300 |
Source: Public Records
Map
Nearby Homes
- 255 Knollwood Dr
- 727 Mendon Rd
- 1001 Brookhaven Ln
- 179 Dawn Blvd
- 68 Kenwood St
- 202 Paine St
- 7 Theresa Marie Ave
- 1088 Diamond Hill Rd
- 194 Paine St
- 79 Saint Agnes Ave
- 89 Saint Agnes Ave
- 366 Aylsworth Ave
- 33 Achille St
- 212 Saint Louis Ave
- 188 Saint Louis Ave
- 178 Saint Louis Ave
- 213 St Louis Ave
- 375 Congress St
- 568 Elm St
- 60 Ruskin Ave
Your Personal Tour Guide
Ask me questions while you tour the home.