Estimated Value: $391,000 - $507,000
3
Beds
3
Baths
2,300
Sq Ft
$194/Sq Ft
Est. Value
About This Home
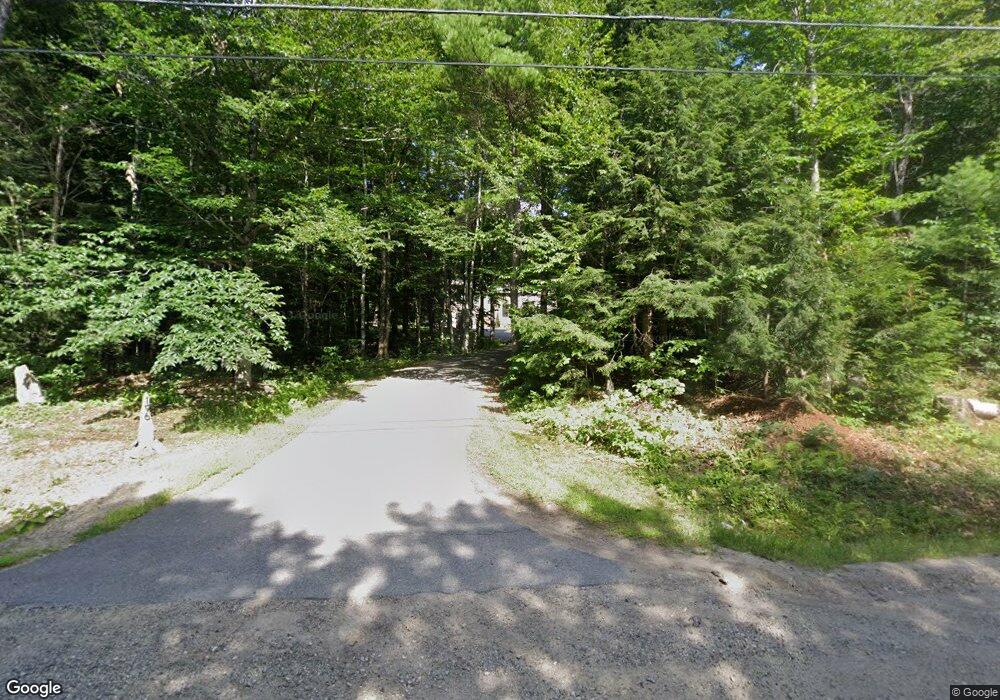
This home is located at 196 Peck Rd, Acton, ME 04001 and is currently estimated at $446,852, approximately $194 per square foot. 196 Peck Rd is a home located in York County with nearby schools including Acton Elementary School.
Ownership History
Date
Name
Owned For
Owner Type
Purchase Details
Closed on
May 29, 2012
Sold by
Moore Dustin J
Bought by
Brandon Karen and Moore Dustin J
Current Estimated Value
Home Financials for this Owner
Home Financials are based on the most recent Mortgage that was taken out on this home.
Original Mortgage
$118,500
Outstanding Balance
$82,317
Interest Rate
3.88%
Mortgage Type
Purchase Money Mortgage
Estimated Equity
$364,535
Purchase Details
Closed on
Dec 11, 2007
Sold by
Linde Renee V and Linde Harry P
Bought by
Dowe Susan E
Home Financials for this Owner
Home Financials are based on the most recent Mortgage that was taken out on this home.
Original Mortgage
$45,000
Interest Rate
6.27%
Mortgage Type
Unknown
Create a Home Valuation Report for This Property
The Home Valuation Report is an in-depth analysis detailing your home's value as well as a comparison with similar homes in the area
Home Values in the Area
Average Home Value in this Area
Purchase History
| Date | Buyer | Sale Price | Title Company |
|---|---|---|---|
| Brandon Karen | -- | -- | |
| Dowe Susan E | $245,000 | -- |
Source: Public Records
Mortgage History
| Date | Status | Borrower | Loan Amount |
|---|---|---|---|
| Open | Brandon Karen | $118,500 | |
| Closed | Dowe Susan E | $45,000 | |
| Closed | Dowe Susan E | $45,000 | |
| Open | Dowe Susan E | $245,000 |
Source: Public Records
Tax History Compared to Growth
Tax History
| Year | Tax Paid | Tax Assessment Tax Assessment Total Assessment is a certain percentage of the fair market value that is determined by local assessors to be the total taxable value of land and additions on the property. | Land | Improvement |
|---|---|---|---|---|
| 2024 | $2,407 | $340,434 | $109,800 | $230,634 |
| 2023 | $2,196 | $340,434 | $109,800 | $230,634 |
| 2022 | $2,156 | $180,454 | $47,888 | $132,566 |
| 2021 | $2,156 | $180,454 | $47,888 | $132,566 |
| 2020 | $2,174 | $180,454 | $47,888 | $132,566 |
| 2019 | $2,174 | $180,454 | $47,888 | $132,566 |
| 2018 | $2,174 | $180,454 | $47,888 | $132,566 |
| 2017 | $2,147 | $180,454 | $47,888 | $132,566 |
| 2016 | $2,030 | $180,454 | $47,888 | $132,566 |
| 2015 | $2,084 | $180,454 | $47,888 | $132,566 |
| 2014 | $2,003 | $180,454 | $47,888 | $132,566 |
Source: Public Records
Map
Nearby Homes