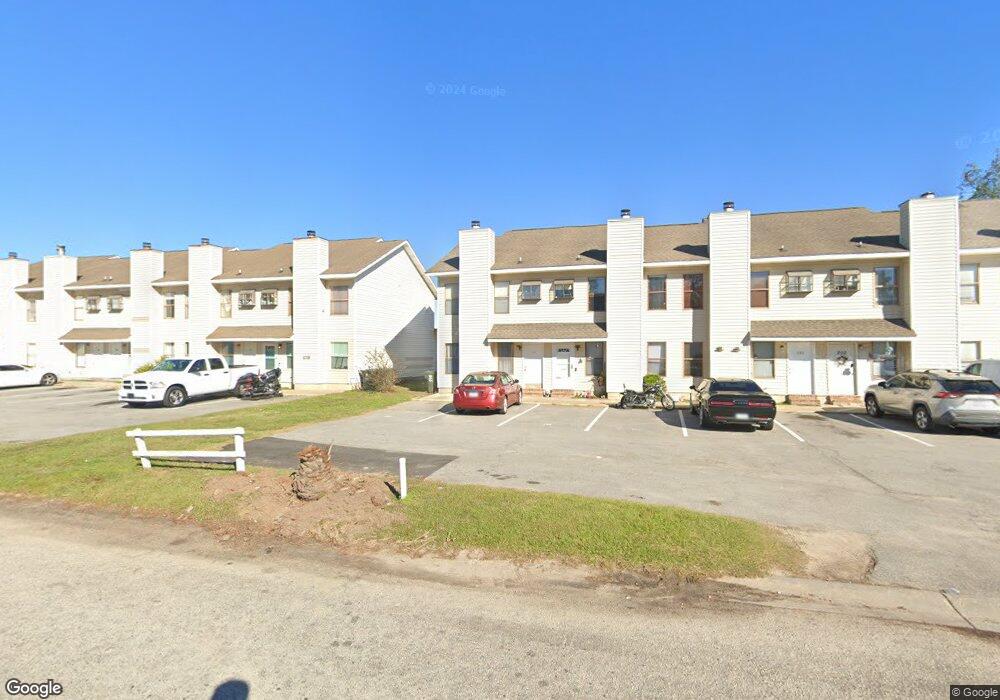
196 Pineshadow Dr Goose Creek, SC 29445
Estimated Value: $203,704 - $220,000
3
Beds
3
Baths
1,342
Sq Ft
$159/Sq Ft
Est. Value
About This Home
This home is located at 196 Pineshadow Dr, Goose Creek, SC 29445 and is currently estimated at $213,176, approximately $158 per square foot. 196 Pineshadow Dr is a home located in Berkeley County with nearby schools including Goose Creek Primary School, Sedgefield Middle School, and Goose Creek High School.
Ownership History
Date
Name
Owned For
Owner Type
Purchase Details
Closed on
May 31, 2022
Sold by
Myers Robert J
Bought by
Premlall Anil
Current Estimated Value
Home Financials for this Owner
Home Financials are based on the most recent Mortgage that was taken out on this home.
Original Mortgage
$176,739
Outstanding Balance
$167,917
Interest Rate
5.1%
Mortgage Type
FHA
Estimated Equity
$45,259
Purchase Details
Closed on
Dec 21, 2005
Sold by
Mable Andrea M
Bought by
Myers Robert J
Home Financials for this Owner
Home Financials are based on the most recent Mortgage that was taken out on this home.
Original Mortgage
$75,050
Interest Rate
10.9%
Mortgage Type
Adjustable Rate Mortgage/ARM
Purchase Details
Closed on
May 1, 2001
Sold by
Karasek Ryan L and Karasek Candy
Bought by
Mable Andrea M
Create a Home Valuation Report for This Property
The Home Valuation Report is an in-depth analysis detailing your home's value as well as a comparison with similar homes in the area
Home Values in the Area
Average Home Value in this Area
Purchase History
| Date | Buyer | Sale Price | Title Company |
|---|---|---|---|
| Premlall Anil | $180,000 | None Listed On Document | |
| Myers Robert J | $79,000 | None Available | |
| Mable Andrea M | $53,000 | -- |
Source: Public Records
Mortgage History
| Date | Status | Borrower | Loan Amount |
|---|---|---|---|
| Open | Premlall Anil | $176,739 | |
| Previous Owner | Myers Robert J | $75,050 |
Source: Public Records
Tax History Compared to Growth
Tax History
| Year | Tax Paid | Tax Assessment Tax Assessment Total Assessment is a certain percentage of the fair market value that is determined by local assessors to be the total taxable value of land and additions on the property. | Land | Improvement |
|---|---|---|---|---|
| 2025 | $2,983 | $189,100 | $30,000 | $159,100 |
| 2024 | $2,983 | $11,346 | $1,800 | $9,546 |
| 2023 | $2,983 | $11,346 | $1,800 | $9,546 |
| 2022 | $1,369 | $7,288 | $1,200 | $6,088 |
| 2021 | $1,378 | $4,300 | $511 | $3,788 |
| 2020 | $1,383 | $4,299 | $511 | $3,788 |
| 2019 | $1,380 | $4,299 | $511 | $3,788 |
| 2018 | $1,297 | $3,738 | $180 | $3,558 |
| 2017 | $1,257 | $3,738 | $180 | $3,558 |
| 2016 | $1,268 | $3,740 | $180 | $3,560 |
| 2015 | $1,215 | $3,740 | $180 | $3,560 |
| 2014 | $1,143 | $3,740 | $180 | $3,560 |
| 2013 | -- | $3,740 | $180 | $3,560 |
Source: Public Records
Map
Nearby Homes
- 195 Pine Shadow Dr
- 148 Pine Shadow Dr
- 235 Pine Shadow Dr
- 40 Clearwater Dr
- 237 Horseshoe Dr
- 202 Buchanan Cir
- 112 Roselle Ave
- 104 Westminster Cir
- 540 Truman Dr
- 215 Jackson St
- 253 Harding Ln
- 251 Harding Ln
- 249 Harding Ln
- 247 Harding Ln
- 228 Harding Ln
- 226 Harding Ln
- 2023 Bearclaw Dr
- 224 Harding Ln
- 222 Harding Ln
- 241 Harding Ln
- 196 Pine Shadow Dr
- 194 Pineshadow Dr
- 198 Pineshadow Dr
- 198 Pine Shadow Dr
- 192 Pine Shadow Dr
- 200 Pineshadow Dr
- 200 Pine Shadow Dr
- 192 Pineshadow Dr
- 190 Pine Shadow Dr
- 202 Pineshadow Dr
- 190 Pineshadow Dr
- 204 Pineshadow Dr
- 204 Pine Shadow Dr
- 204 Pine Shadow Dr Unit 204
- 188 Pineshadow Dr
- 186 Pine Shadow Dr
- 186 Pineshadow Dr
- 206 Pineshadow Dr
- 206 Pine Shadow Dr
- 184 Pineshadow Dr