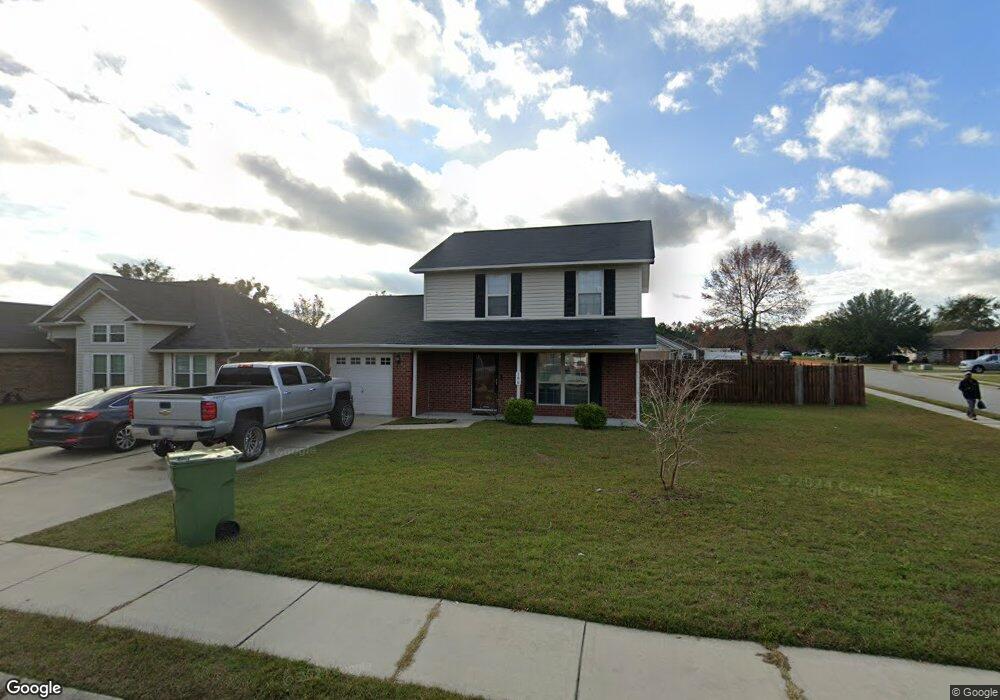
196 Wayfair Ln Unit 158 Hinesville, GA 31313
Estimated Value: $221,000 - $237,000
3
Beds
3
Baths
1,380
Sq Ft
$167/Sq Ft
Est. Value
About This Home
This home is located at 196 Wayfair Ln Unit 158, Hinesville, GA 31313 and is currently estimated at $230,505, approximately $167 per square foot. 196 Wayfair Ln Unit 158 is a home located in Liberty County with nearby schools including Lyman Hall Elementary School, Lewis Frasier Middle School, and Bradwell Institute.
Ownership History
Date
Name
Owned For
Owner Type
Purchase Details
Closed on
Feb 28, 2014
Sold by
Sec Of Veterans Affa
Bought by
Greek Joushua E
Current Estimated Value
Home Financials for this Owner
Home Financials are based on the most recent Mortgage that was taken out on this home.
Original Mortgage
$100,617
Outstanding Balance
$76,293
Interest Rate
4.35%
Mortgage Type
VA
Estimated Equity
$154,212
Purchase Details
Closed on
Jul 25, 2013
Sold by
Heath Brandon
Bought by
Wells Fargo Bank
Purchase Details
Closed on
Sep 19, 2007
Sold by
Wilcox Milton L
Bought by
Heath Brandon and Heath Tiffany
Home Financials for this Owner
Home Financials are based on the most recent Mortgage that was taken out on this home.
Original Mortgage
$125,644
Interest Rate
6.49%
Mortgage Type
VA
Purchase Details
Closed on
May 14, 2004
Sold by
Dryden Ent Inc
Bought by
Wilcox Milton and Wilcox Amanda
Purchase Details
Closed on
May 15, 2001
Sold by
Waters Dennis A
Bought by
Dryden Enterprises Inc
Create a Home Valuation Report for This Property
The Home Valuation Report is an in-depth analysis detailing your home's value as well as a comparison with similar homes in the area
Home Values in the Area
Average Home Value in this Area
Purchase History
| Date | Buyer | Sale Price | Title Company |
|---|---|---|---|
| Greek Joushua E | $98,500 | -- | |
| Wells Fargo Bank | $124,117 | -- | |
| Heath Brandon | $123,000 | -- | |
| Wilcox Milton | $99,400 | -- | |
| Dryden Enterprises Inc | -- | -- |
Source: Public Records
Mortgage History
| Date | Status | Borrower | Loan Amount |
|---|---|---|---|
| Open | Greek Joushua E | $100,617 | |
| Previous Owner | Heath Brandon | $125,644 |
Source: Public Records
Tax History Compared to Growth
Tax History
| Year | Tax Paid | Tax Assessment Tax Assessment Total Assessment is a certain percentage of the fair market value that is determined by local assessors to be the total taxable value of land and additions on the property. | Land | Improvement |
|---|---|---|---|---|
| 2024 | $3,711 | $75,556 | $14,000 | $61,556 |
| 2023 | $3,711 | $67,031 | $10,000 | $57,031 |
| 2022 | $2,440 | $52,345 | $8,000 | $44,345 |
| 2021 | $2,274 | $47,879 | $8,000 | $39,879 |
| 2020 | $2,143 | $44,670 | $8,000 | $36,670 |
| 2019 | $2,147 | $45,087 | $8,000 | $37,087 |
| 2018 | $1,979 | $41,753 | $8,000 | $33,753 |
| 2017 | $1,387 | $42,128 | $8,000 | $34,128 |
| 2016 | $1,919 | $42,504 | $8,000 | $34,504 |
| 2015 | $2,346 | $45,704 | $11,200 | $34,504 |
| 2014 | $2,346 | $51,501 | $11,200 | $40,301 |
| 2013 | -- | $50,003 | $11,200 | $38,803 |
Source: Public Records
Map
Nearby Homes
- 186 Wayfair Ln
- 184 Glendale Ln
- 401 Barry McCaffrey Blvd Unit E2
- 316 Clairemore Cir
- 418 Lancaster Loop
- 265 Miller St
- 122 Joann Lewis Ln
- 278 Joann Lewis Ln
- 170 Joann Lewis Ln
- 315 Joann Lewis Ln
- 2012 Ossabaw Dr
- 74 Rosebud Ct
- 1654 Latham Ct
- 1654 Latham Ct Unit 34
- 1385 Coalition Cir
- 130 Mattie St
- 1389 Coalition Cir
- 1352 Forest Lake Dr
- 113 Kevin Rd
- 1393 Coalition Cir
- 196 Wayfair Ln Unit n/a
- 196 Wayfair Ln
- 194 Wayfair Ln
- 216 Bridgemont Way
- 202 Lonsdale Ln
- 192 Wayfair Ln
- 204 Lonsdale Ln
- 217 Bridgemont Way
- 195 Wayfair Ln Unit n/a
- 190 Wayfair Ln
- 193 Wayfair Ln
- 0 Lonsdale Ln
- 197 Wayfair Ln
- 215 Bridgemont Way
- 206 Lonsdale Ln
- 191 Wayfair Ln
- 188 Wayfair Ln
- 201 Lonsdale Ln