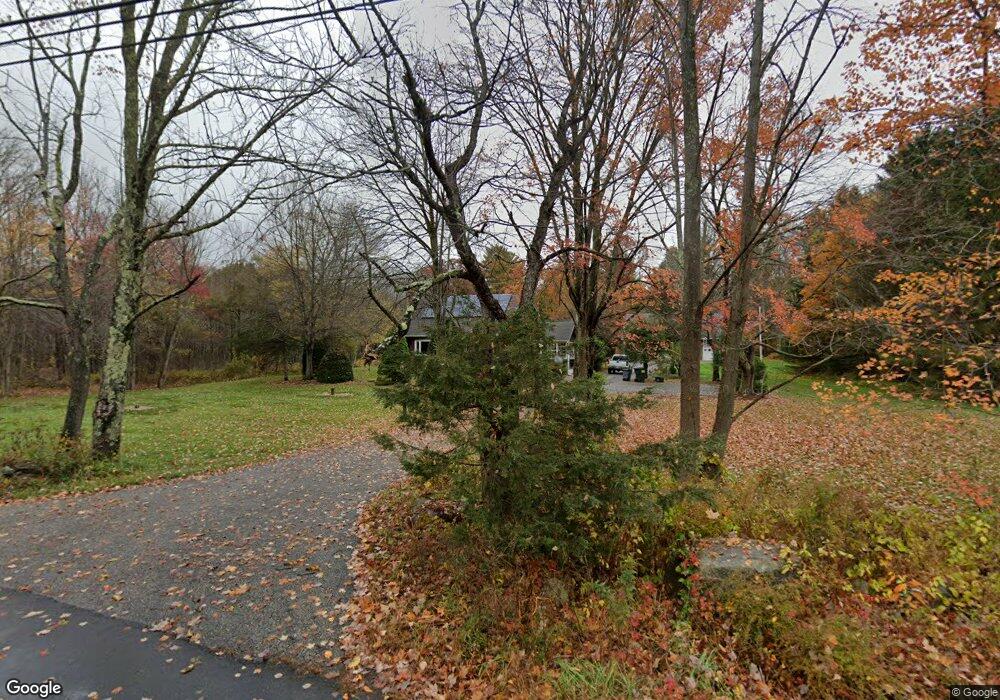
196 West St Uxbridge, MA 01569
Estimated Value: $561,748 - $746,000
3
Beds
2
Baths
1,862
Sq Ft
$339/Sq Ft
Est. Value
About This Home
This home is located at 196 West St, Uxbridge, MA 01569 and is currently estimated at $631,187, approximately $338 per square foot. 196 West St is a home located in Worcester County with nearby schools including Uxbridge High School and Our Lady of the Valley Regional School.
Ownership History
Date
Name
Owned For
Owner Type
Purchase Details
Closed on
Feb 2, 2022
Sold by
Nolin Michael A and Nolin Suzie B
Bought by
Mnsb Ret
Current Estimated Value
Purchase Details
Closed on
May 26, 1994
Sold by
Conlon Thomas A and Conlon Elise M
Bought by
Nolin Michael A and Boilard Suzie
Home Financials for this Owner
Home Financials are based on the most recent Mortgage that was taken out on this home.
Original Mortgage
$137,650
Interest Rate
8.22%
Mortgage Type
Purchase Money Mortgage
Create a Home Valuation Report for This Property
The Home Valuation Report is an in-depth analysis detailing your home's value as well as a comparison with similar homes in the area
Home Values in the Area
Average Home Value in this Area
Purchase History
| Date | Buyer | Sale Price | Title Company |
|---|---|---|---|
| Mnsb Ret | -- | None Available | |
| Nolin Michael A | $144,900 | -- |
Source: Public Records
Mortgage History
| Date | Status | Borrower | Loan Amount |
|---|---|---|---|
| Previous Owner | Nolin Michael A | $20,000 | |
| Previous Owner | Nolin Michael A | $127,000 | |
| Previous Owner | Nolin Michael A | $135,900 | |
| Previous Owner | Nolin Michael A | $137,650 |
Source: Public Records
Tax History
| Year | Tax Paid | Tax Assessment Tax Assessment Total Assessment is a certain percentage of the fair market value that is determined by local assessors to be the total taxable value of land and additions on the property. | Land | Improvement |
|---|---|---|---|---|
| 2025 | $58 | $438,900 | $177,800 | $261,100 |
| 2024 | $5,403 | $418,200 | $169,100 | $249,100 |
| 2023 | $5,127 | $367,500 | $145,800 | $221,700 |
| 2022 | $4,939 | $325,800 | $128,400 | $197,400 |
| 2021 | $4,996 | $315,800 | $125,800 | $190,000 |
| 2020 | $5,196 | $310,400 | $124,000 | $186,400 |
| 2019 | $5,221 | $300,900 | $124,000 | $176,900 |
| 2018 | $4,866 | $283,400 | $124,000 | $159,400 |
| 2017 | $4,681 | $276,000 | $114,200 | $161,800 |
| 2016 | $4,568 | $260,000 | $108,900 | $151,100 |
| 2015 | $4,481 | $257,500 | $108,900 | $148,600 |
Source: Public Records
Map
Nearby Homes
- 145 Mantell Rd
- 169 Mantell Rd
- 137 Mantell Rd
- 405 West St
- 11 Summerfield Dr Unit 11
- 153 Davis St
- 376 Douglas St
- 395 High St
- 61 Spring Hill Dr Unit 61
- 99 Maple St
- 296 Yew St
- 86 Hunter Rd
- 1 White Ct
- 2 White Ct
- 408 NE Main St
- 5 B St
- 22 Gilboa St
- 127 Turner Farm Rd
- 139 Turner Farm Rd
- 197 Crownshield Ave Unit 16B
Your Personal Tour Guide
Ask me questions while you tour the home.