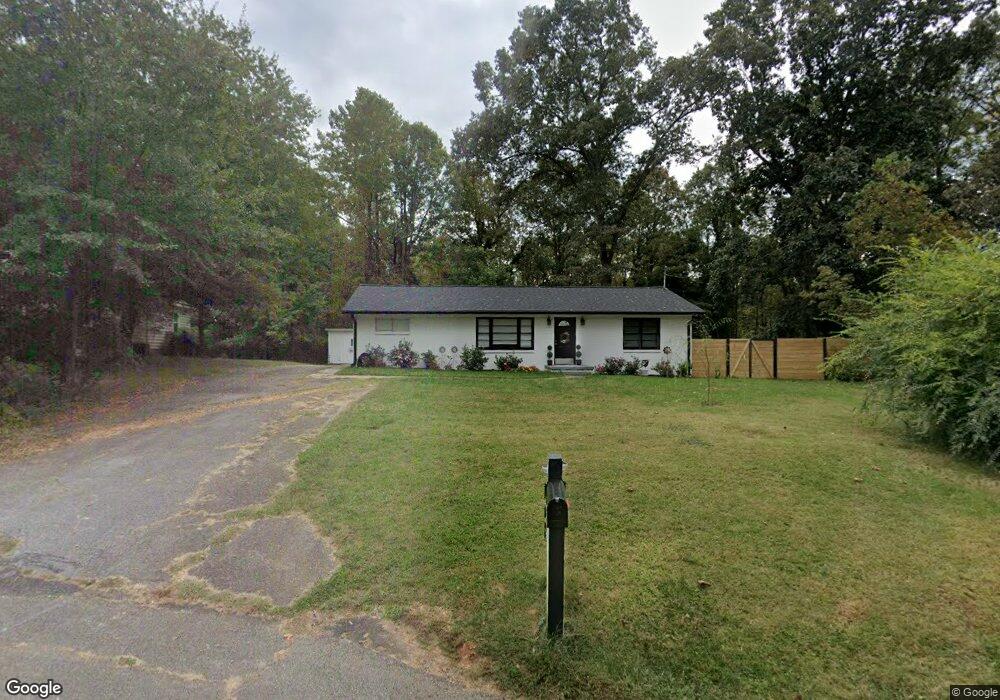
196 Woodvale St Clarkesville, GA 30523
Estimated Value: $283,000 - $329,000
3
Beds
2
Baths
1,605
Sq Ft
$191/Sq Ft
Est. Value
About This Home
This home is located at 196 Woodvale St, Clarkesville, GA 30523 and is currently estimated at $306,223, approximately $190 per square foot. 196 Woodvale St is a home located in Habersham County with nearby schools including Clarkesville Elementary School, North Habersham Middle School, and Habersham Success Academy.
Ownership History
Date
Name
Owned For
Owner Type
Purchase Details
Closed on
Jul 20, 2021
Sold by
Buff & Bolch Capital Llc
Bought by
Williams Andrew and Williams Macy
Current Estimated Value
Home Financials for this Owner
Home Financials are based on the most recent Mortgage that was taken out on this home.
Original Mortgage
$232,323
Outstanding Balance
$211,118
Interest Rate
3%
Mortgage Type
New Conventional
Estimated Equity
$95,105
Purchase Details
Closed on
May 4, 2020
Sold by
Buffington Brian C
Bought by
Buff & Bolch Capital Llc
Purchase Details
Closed on
Feb 28, 2019
Sold by
Batarseh Jennifer Ivon
Bought by
Buffington Brian C and Bolchoz Joshua
Home Financials for this Owner
Home Financials are based on the most recent Mortgage that was taken out on this home.
Original Mortgage
$80,750
Interest Rate
4.4%
Mortgage Type
Commercial
Purchase Details
Closed on
Apr 12, 2013
Sold by
Payne I James
Bought by
Batarseh I Jennifer
Create a Home Valuation Report for This Property
The Home Valuation Report is an in-depth analysis detailing your home's value as well as a comparison with similar homes in the area
Home Values in the Area
Average Home Value in this Area
Purchase History
| Date | Buyer | Sale Price | Title Company |
|---|---|---|---|
| Williams Andrew | $225,000 | -- | |
| Buff & Bolch Capital Llc | -- | -- | |
| Buffington Brian C | $95,000 | -- | |
| Batarseh I Jennifer | -- | -- |
Source: Public Records
Mortgage History
| Date | Status | Borrower | Loan Amount |
|---|---|---|---|
| Open | Williams Andrew | $232,323 | |
| Previous Owner | Buffington Brian C | $80,750 |
Source: Public Records
Tax History Compared to Growth
Tax History
| Year | Tax Paid | Tax Assessment Tax Assessment Total Assessment is a certain percentage of the fair market value that is determined by local assessors to be the total taxable value of land and additions on the property. | Land | Improvement |
|---|---|---|---|---|
| 2025 | $4,188 | $131,103 | $23,808 | $107,295 |
| 2024 | -- | $120,168 | $23,880 | $96,288 |
| 2023 | $1,940 | $103,480 | $23,880 | $79,600 |
| 2022 | $2,343 | $89,848 | $21,892 | $67,956 |
| 2021 | $1,736 | $66,872 | $15,920 | $50,952 |
| 2020 | $1,554 | $57,788 | $13,932 | $43,856 |
| 2019 | $1,217 | $57,788 | $13,932 | $43,856 |
| 2018 | $1,207 | $45,196 | $13,932 | $31,264 |
| 2017 | $1,149 | $42,788 | $13,932 | $28,856 |
| 2016 | $1,053 | $100,950 | $13,932 | $26,448 |
| 2015 | $1,041 | $100,950 | $13,932 | $26,448 |
| 2014 | $1,052 | $100,210 | $13,932 | $26,152 |
| 2013 | -- | $40,084 | $13,932 | $26,152 |
Source: Public Records
Map
Nearby Homes
- 112 Woodland St
- 551 W Water St
- 325 Springwood Dr
- 0 Ivy Ridge Way Unit LOT 40 10327774
- 0 Ivy Ridge Way Unit LOT 6 10487513
- 0 Ivy Ridge Way Unit LOT 50 10487398
- 0 Highlands Lake Trail Unit LOT 30 10600443
- 0 Highlands Lake Trail Unit 7646133
- 176 Llewellyn St
- 172 Llewellyn St
- 180 Llewellyn St
- 745 Washington St
- 205 Flesner Ct
- 148 Village Dr
- 135 Village Dr
- 643 Washington St
- 213 N Laurel Dr
- 449 E Water St
- 447 E Water St
- 451 E Water St
- 196 Woodvale St Unit 69
- 182 Woodvale St
- 225 Woodvale St
- 225 Woodvale St Unit 60
- 230 Woodvale St
- 0 Woodvale St Unit 8636699
- 0 Woodvale St Unit 9005188
- 0 Woodvale St Unit 9055539
- 0 Woodvale St Unit 8770193
- 0 Woodvale St Unit 7415144
- 167 Woodvale St
- 246 Woodvale St
- 237 Woodvale St
- 146 Woodvale St
- 143 Woodvale St
- 267 Bartley Wilbanks Rd
- 399 Bartley Wilbanks Rd
- 120 Woodvale St
- 374 Bartley Wilbanks Rd
- 119 Woodvale St