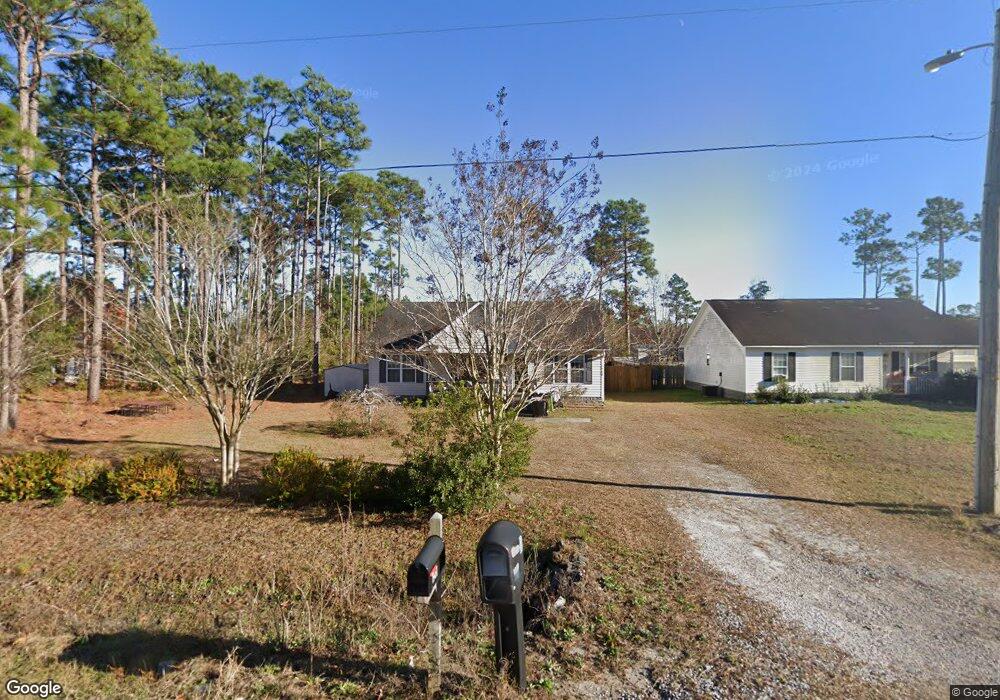
1960 Raeford Rd Unit Boiling Spring Lakes Southport, NC 28461
Estimated Value: $271,867 - $307,000
3
Beds
2
Baths
1,200
Sq Ft
$246/Sq Ft
Est. Value
About This Home
This home is located at 1960 Raeford Rd Unit Boiling Spring Lakes, Southport, NC 28461 and is currently estimated at $295,717, approximately $246 per square foot. 1960 Raeford Rd Unit Boiling Spring Lakes is a home located in Brunswick County with nearby schools including Bolivia Elementary School, South Brunswick Middle School, and South Brunswick High School.
Ownership History
Date
Name
Owned For
Owner Type
Purchase Details
Closed on
Mar 14, 2018
Sold by
Sullivan Michelle Bowling
Bought by
Lane Alexis R and Barrier Andrew T
Current Estimated Value
Home Financials for this Owner
Home Financials are based on the most recent Mortgage that was taken out on this home.
Original Mortgage
$160,606
Outstanding Balance
$137,101
Interest Rate
4.22%
Mortgage Type
New Conventional
Estimated Equity
$158,616
Purchase Details
Closed on
Jan 26, 2017
Sold by
Bowling Michelle Silvia and Sullivan Ryan Matthew
Bought by
Bowling Sullivan Michelle
Home Financials for this Owner
Home Financials are based on the most recent Mortgage that was taken out on this home.
Original Mortgage
$124,190
Interest Rate
3.37%
Mortgage Type
New Conventional
Purchase Details
Closed on
Apr 27, 2007
Sold by
Beitel Remona and Beitel Robert A
Bought by
Blake Home Builders Inc
Purchase Details
Closed on
Sep 9, 2005
Sold by
Brock John E and Brock Maratha R
Bought by
Beitel Romona
Create a Home Valuation Report for This Property
The Home Valuation Report is an in-depth analysis detailing your home's value as well as a comparison with similar homes in the area
Home Values in the Area
Average Home Value in this Area
Purchase History
| Date | Buyer | Sale Price | Title Company |
|---|---|---|---|
| Lane Alexis R | $159,000 | None Available | |
| Bowling Sullivan Michelle | -- | American Home Title | |
| Blake Home Builders Inc | $38,000 | None Available | |
| Beitel Romona | $8,000 | None Available |
Source: Public Records
Mortgage History
| Date | Status | Borrower | Loan Amount |
|---|---|---|---|
| Open | Lane Alexis R | $160,606 | |
| Previous Owner | Bowling Sullivan Michelle | $124,190 |
Source: Public Records
Tax History Compared to Growth
Tax History
| Year | Tax Paid | Tax Assessment Tax Assessment Total Assessment is a certain percentage of the fair market value that is determined by local assessors to be the total taxable value of land and additions on the property. | Land | Improvement |
|---|---|---|---|---|
| 2025 | $1,480 | $240,690 | $14,500 | $226,190 |
| 2024 | $1,480 | $240,690 | $14,500 | $226,190 |
| 2023 | $1,379 | $240,690 | $14,500 | $226,190 |
| 2022 | $1,379 | $160,090 | $9,000 | $151,090 |
| 2021 | $1,365 | $160,090 | $9,000 | $151,090 |
| 2020 | $1,282 | $160,090 | $9,000 | $151,090 |
| 2019 | $1,282 | $12,490 | $9,000 | $3,490 |
| 2018 | $1,017 | $15,580 | $12,000 | $3,580 |
| 2017 | $992 | $15,580 | $12,000 | $3,580 |
| 2016 | $967 | $15,580 | $12,000 | $3,580 |
| 2015 | $967 | $124,740 | $12,000 | $112,740 |
| 2014 | $908 | $131,883 | $20,000 | $111,883 |
Source: Public Records
Map
Nearby Homes
- 1990 Salisbury Rd
- 1950 Salisbury Rd
- 1840 Raeford Rd
- 1854 Salisbury Rd
- 1951 E Boiling Spring Rd
- 1848 Salisbury Rd
- 1820 Raeford Rd
- 1810 Raeford Rd
- Lot 10 E Boiling Spring Rd
- 1996 E Boiling Spring Rd
- 2695 E Boiling Spring Rd
- L-272 E Boiling Spring Rd
- 2041 Pinehurst Rd
- 1858 E Boiling Spring Rd
- 2031 Pinehurst
- 32 S High Point Rd
- 2010 Albemarle Rd
- 1780 Salisbury Rd
- 0 Greensboro Rd
- Lot 1 Brooke Ridge Ln
- 1960 Raeford Rd Unit Bsl
- 1960 Raeford Rd
- 1950 Raeford Rd
- Lot 13 Reaford
- 1961 Raeford Rd
- 1941 Raeford Rd
- 1980 Raeford Rd
- 1971 Raeford Rd
- 1961 Reidsville Rd
- 1951 Reidsville Rd
- 1931 Raeford Rd
- 1920 Raeford Rd
- 1971 Reidsville Rd
- 1941 Reidsville Rd
- 1990 Raeford Rd
- 1981 Reidsville Rd
- 1981 Reidsville Rd Unit Bsl
- 1991 Raeford Rd
- 1931 Reidsville Rd
- 1991 Reidsville Rd