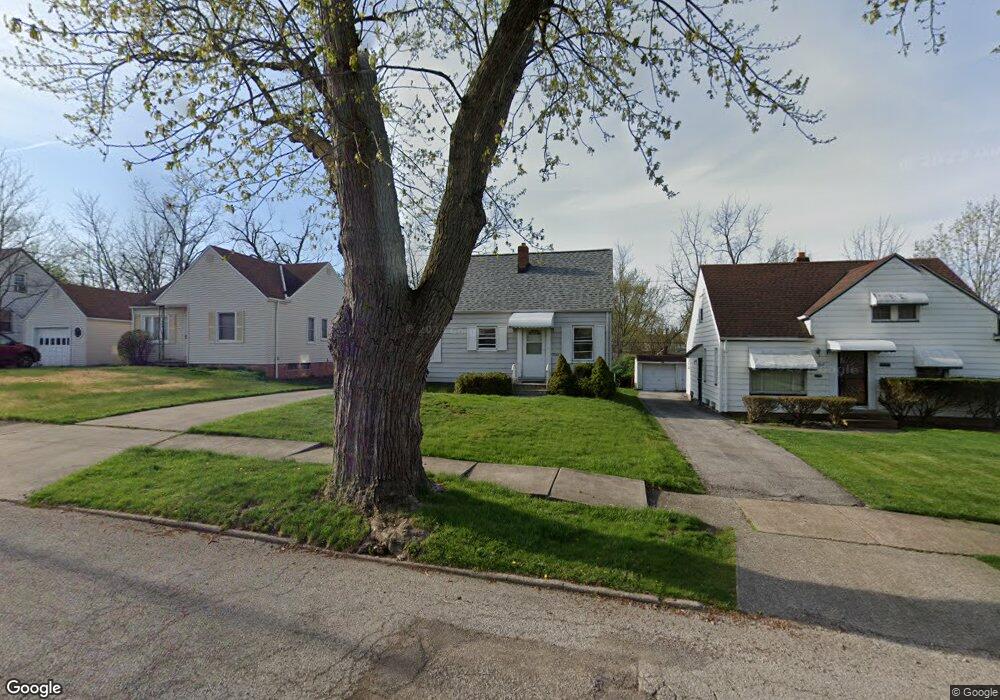
19604 Nitra Ave Maple Heights, OH 44137
Estimated Value: $100,967 - $149,000
2
Beds
1
Bath
900
Sq Ft
$131/Sq Ft
Est. Value
About This Home
This home is located at 19604 Nitra Ave, Maple Heights, OH 44137 and is currently estimated at $117,492, approximately $130 per square foot. 19604 Nitra Ave is a home located in Cuyahoga County with nearby schools including Abraham Lincoln Elementary School, Rockside/ J.F. Kennedy School, and Barack Obama School.
Ownership History
Date
Name
Owned For
Owner Type
Purchase Details
Closed on
Jul 25, 2007
Sold by
Irby Blanche M
Bought by
Irby Darnell
Current Estimated Value
Purchase Details
Closed on
Nov 11, 2002
Sold by
Irby John and Irby Blanche
Bought by
Irby Blanche M
Purchase Details
Closed on
Apr 26, 1996
Sold by
Thompson Sharonda
Bought by
Irby John and Irby Blanch
Home Financials for this Owner
Home Financials are based on the most recent Mortgage that was taken out on this home.
Original Mortgage
$55,100
Interest Rate
7.91%
Mortgage Type
New Conventional
Purchase Details
Closed on
Oct 31, 1995
Sold by
Novak Edwin
Bought by
Thompson Sharonda
Purchase Details
Closed on
Jan 1, 1991
Bought by
Novak Edwin
Create a Home Valuation Report for This Property
The Home Valuation Report is an in-depth analysis detailing your home's value as well as a comparison with similar homes in the area
Home Values in the Area
Average Home Value in this Area
Purchase History
| Date | Buyer | Sale Price | Title Company |
|---|---|---|---|
| Irby Darnell | -- | Title Access Llc | |
| Irby Blanche M | -- | -- | |
| Irby John | $58,000 | -- | |
| Thompson Sharonda | $56,900 | -- | |
| Novak Edwin | -- | -- |
Source: Public Records
Mortgage History
| Date | Status | Borrower | Loan Amount |
|---|---|---|---|
| Previous Owner | Irby John | $55,100 |
Source: Public Records
Tax History
| Year | Tax Paid | Tax Assessment Tax Assessment Total Assessment is a certain percentage of the fair market value that is determined by local assessors to be the total taxable value of land and additions on the property. | Land | Improvement |
|---|---|---|---|---|
| 2025 | $2,838 | $33,495 | $6,720 | $26,775 |
| 2024 | $3,148 | $33,495 | $6,720 | $26,775 |
| 2023 | $1,942 | $16,660 | $4,060 | $12,600 |
| 2022 | $1,935 | $16,660 | $4,060 | $12,600 |
| 2021 | $2,057 | $16,660 | $4,060 | $12,600 |
| 2020 | $1,776 | $12,640 | $3,080 | $9,560 |
| 2019 | $1,763 | $36,100 | $8,800 | $27,300 |
| 2018 | $1,662 | $12,640 | $3,080 | $9,560 |
| 2017 | $1,706 | $11,940 | $2,870 | $9,070 |
| 2016 | $1,649 | $11,940 | $2,870 | $9,070 |
| 2015 | $1,635 | $11,940 | $2,870 | $9,070 |
| 2014 | $1,635 | $13,130 | $3,150 | $9,980 |
Source: Public Records
Map
Nearby Homes
- 5165 Camden Rd
- 19931 Raymond St
- 19520 Maple Heights Blvd
- 18990 Raymond St
- 5194 Homewood Ave
- 18915 Longview Ave
- 18851 Raymond St
- 19910 Mountville Dr
- 20111 Mountville Dr
- 5147 Warrensville Center Rd
- 20600 Watson Rd
- 19289 Stafford Ave
- 18715 Libby Rd
- 19411 Marvin Rd
- 5127 Erwin St
- 20715 Watson Rd
- 20705 Hansen Rd
- 18909 Maple Heights Blvd
- 5100 Erwin St
- 20814 Clare Ave
- 19602 Nitra Ave
- 19612 Nitra Ave
- 19518 Nitra Ave
- 19514 Nitra Ave
- 19616 Nitra Ave
- 19601 Milan Dr
- 19517 Milan Dr
- 19513 Milan Dr
- 19609 Milan Dr
- 19510 Nitra Ave
- 19700 Nitra Ave
- 19509 Milan Dr
- 19605 Nitra Ave
- 19613 Milan Dr
- 19609 Nitra Ave
- 19601 Nitra Ave
- 19613 Nitra Ave
- 19517 Nitra Ave
- 19506 Nitra Ave
- 19505 Milan Dr
Your Personal Tour Guide
Ask me questions while you tour the home.