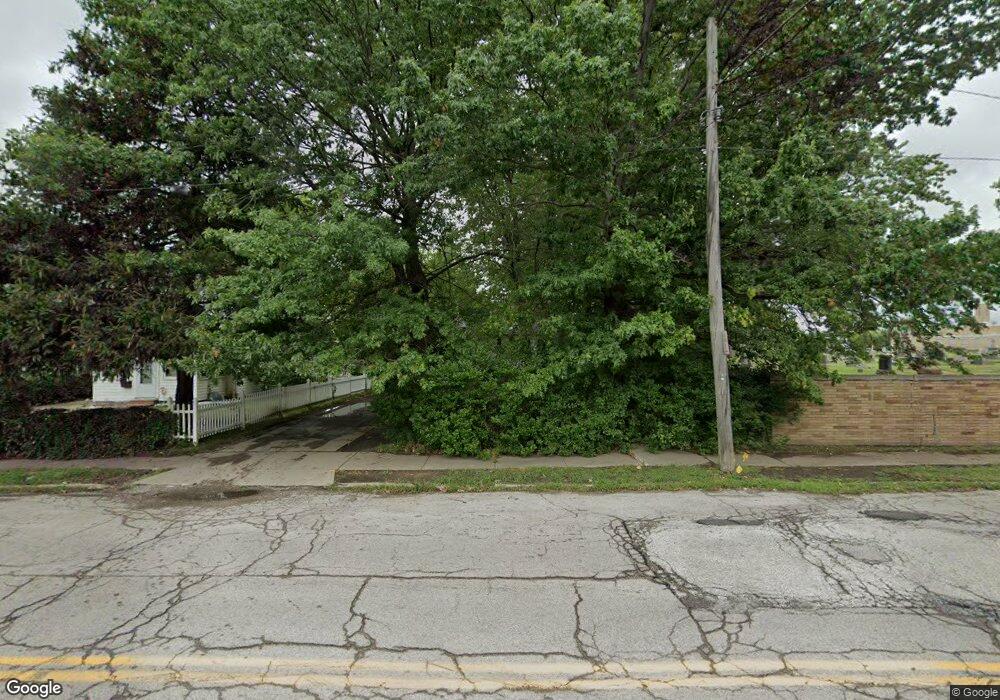
19609 Chardon Rd Euclid, OH 44117
Estimated Value: $79,797 - $115,000
4
Beds
1
Bath
1,154
Sq Ft
$90/Sq Ft
Est. Value
About This Home
This home is located at 19609 Chardon Rd, Euclid, OH 44117 and is currently estimated at $103,949, approximately $90 per square foot. 19609 Chardon Rd is a home located in Cuyahoga County with nearby schools including Noble Academy-Cleveland, Imagine Bella Academy of Excellence, and Lakeshore Intergenerational School.
Ownership History
Date
Name
Owned For
Owner Type
Purchase Details
Closed on
Sep 22, 1995
Sold by
Teague Mattie L
Bought by
Caynor Ronald M
Current Estimated Value
Home Financials for this Owner
Home Financials are based on the most recent Mortgage that was taken out on this home.
Original Mortgage
$38,800
Interest Rate
7.78%
Mortgage Type
New Conventional
Purchase Details
Closed on
Jul 12, 1991
Sold by
Teague Albert B
Bought by
Teague Mattie L
Purchase Details
Closed on
Aug 28, 1981
Sold by
Ruby Hicks
Bought by
Teague Albert B
Purchase Details
Closed on
Jan 12, 1978
Sold by
Hicks Paul
Bought by
Ruby Hicks
Purchase Details
Closed on
Sep 21, 1976
Sold by
Hicks Paul and Hicks Ruby
Bought by
Hicks Paul
Purchase Details
Closed on
Dec 4, 1975
Sold by
Martin Dewey L
Bought by
Hicks Paul and Hicks Ruby
Purchase Details
Closed on
Jan 1, 1975
Bought by
Martin Dewey L
Create a Home Valuation Report for This Property
The Home Valuation Report is an in-depth analysis detailing your home's value as well as a comparison with similar homes in the area
Home Values in the Area
Average Home Value in this Area
Purchase History
| Date | Buyer | Sale Price | Title Company |
|---|---|---|---|
| Caynor Ronald M | $40,000 | -- | |
| Teague Mattie L | -- | -- | |
| Teague Albert B | $27,500 | -- | |
| Ruby Hicks | -- | -- | |
| Hicks Paul | -- | -- | |
| Hicks Paul | $15,000 | -- | |
| Martin Dewey L | -- | -- |
Source: Public Records
Mortgage History
| Date | Status | Borrower | Loan Amount |
|---|---|---|---|
| Closed | Caynor Ronald M | $38,800 |
Source: Public Records
Tax History
| Year | Tax Paid | Tax Assessment Tax Assessment Total Assessment is a certain percentage of the fair market value that is determined by local assessors to be the total taxable value of land and additions on the property. | Land | Improvement |
|---|---|---|---|---|
| 2025 | $803 | $12,250 | $4,900 | $7,350 |
| 2024 | $803 | $12,250 | $4,900 | $7,350 |
| 2023 | $784 | $10,330 | $3,500 | $6,830 |
| 2022 | $779 | $10,330 | $3,500 | $6,830 |
| 2021 | $771 | $10,330 | $3,500 | $6,830 |
| 2020 | $783 | $9,070 | $3,080 | $5,990 |
| 2019 | $3,716 | $25,900 | $8,800 | $17,100 |
| 2018 | $722 | $9,070 | $3,080 | $5,990 |
| 2017 | $809 | $9,810 | $3,400 | $6,410 |
| 2016 | $803 | $9,810 | $3,400 | $6,410 |
| 2015 | $926 | $9,810 | $3,400 | $6,410 |
| 2014 | $926 | $11,280 | $3,890 | $7,390 |
Source: Public Records
Map
Nearby Homes
- 18526 Underwood Ave
- 19316 Shawnee Ave
- 19210 Firwood Rd
- 1311 E 187th St
- 19211 Chickasaw Ave
- 19409 Cherokee Ave
- 18402 Edgerton Rd
- 19600 Arrowhead Ave
- 983 E 179th St
- 1545 E 214th St
- 1402 E 185th St
- 824 E 207th St
- 18314 La Salle Rd
- 19810 Muskoka Ave
- 1113 E 177th St
- 18033 Marcella Rd
- 19115 Muskoka Ave
- 1554 E 221st St
- 19417 Mohawk Ave
- 1476 Clermont Rd
- 19605 Chardon Rd
- 19601 Chardon Rd
- 19505 Chardon Rd
- 19500 Saint Clair Ave
- 19510 Saint Clair Ave
- 19501 Chardon Rd
- 19506 Saint Clair Ave
- 19770 Saint Clair Ave
- 19401 St Clair Ave
- 1231 Chardon Rd
- 1084 E 200th St
- 1066 E 200th St
- 1060 E 200th St
- 1054 E 200th St
- 19215 Saint Clair Ave
- 19800 S Waterloo Rd
- 20020 Saint Clair Ave
- 608610 E 200th
- 19415 Nyack Ct
- 19413 Nyack Ct
Your Personal Tour Guide
Ask me questions while you tour the home.