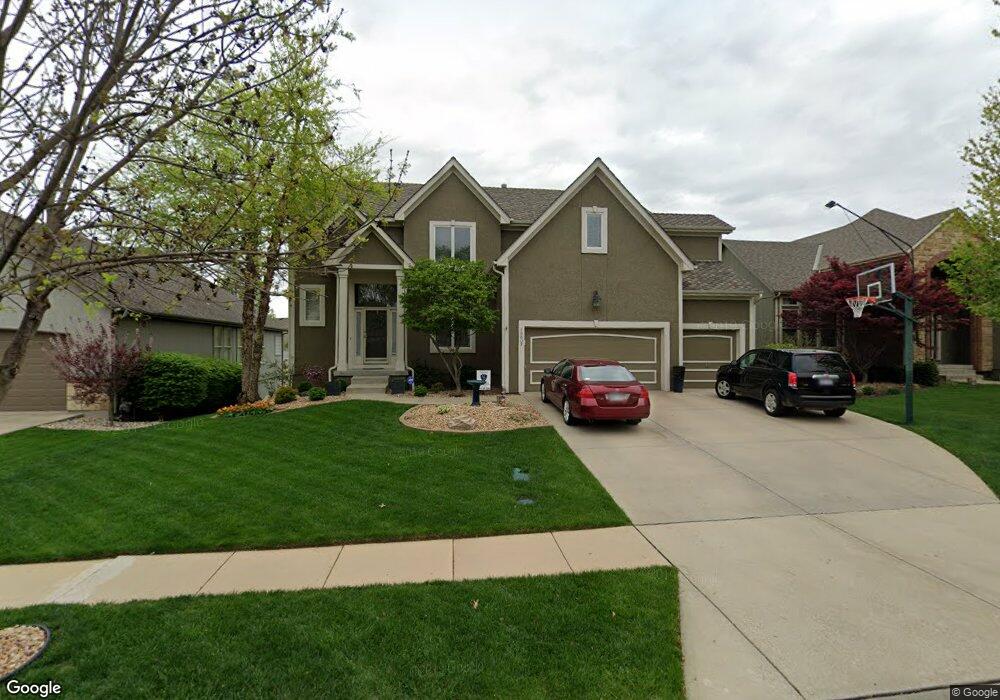
19609 W 97th Terrace Lenexa, KS 66220
Estimated Value: $524,000 - $577,000
4
Beds
4
Baths
2,578
Sq Ft
$213/Sq Ft
Est. Value
About This Home
This home is located at 19609 W 97th Terrace, Lenexa, KS 66220 and is currently estimated at $549,573, approximately $213 per square foot. 19609 W 97th Terrace is a home located in Johnson County with nearby schools including Manchester Park Elementary School, Prairie Trail Middle School, and Olathe Northwest High School.
Ownership History
Date
Name
Owned For
Owner Type
Purchase Details
Closed on
Aug 21, 2002
Sold by
J S Robinson Construction Inc
Bought by
Parsons Michael P and Parsons Lisa M
Current Estimated Value
Home Financials for this Owner
Home Financials are based on the most recent Mortgage that was taken out on this home.
Original Mortgage
$215,950
Outstanding Balance
$79,505
Interest Rate
5.25%
Estimated Equity
$470,068
Purchase Details
Closed on
Nov 24, 2001
Sold by
Falcon Valley Llc
Bought by
J S Robinson Construction Inc
Home Financials for this Owner
Home Financials are based on the most recent Mortgage that was taken out on this home.
Original Mortgage
$178,400
Interest Rate
6.57%
Create a Home Valuation Report for This Property
The Home Valuation Report is an in-depth analysis detailing your home's value as well as a comparison with similar homes in the area
Home Values in the Area
Average Home Value in this Area
Purchase History
| Date | Buyer | Sale Price | Title Company |
|---|---|---|---|
| Parsons Michael P | -- | Security Land Title Company | |
| J S Robinson Construction Inc | -- | Security Land Title Company |
Source: Public Records
Mortgage History
| Date | Status | Borrower | Loan Amount |
|---|---|---|---|
| Open | Parsons Michael P | $215,950 | |
| Previous Owner | J S Robinson Construction Inc | $178,400 | |
| Closed | J S Robinson Construction Inc | $54,900 |
Source: Public Records
Tax History
| Year | Tax Paid | Tax Assessment Tax Assessment Total Assessment is a certain percentage of the fair market value that is determined by local assessors to be the total taxable value of land and additions on the property. | Land | Improvement |
|---|---|---|---|---|
| 2025 | $6,928 | $57,845 | $12,054 | $45,791 |
| 2023 | $6,829 | $54,544 | $12,054 | $42,490 |
| 2022 | $6,326 | $49,266 | $9,267 | $39,999 |
| 2021 | $5,891 | $43,620 | $9,267 | $34,353 |
| 2020 | $5,308 | $38,882 | $9,267 | $29,615 |
| 2019 | $5,380 | $39,123 | $8,063 | $31,060 |
| 2018 | $5,048 | $36,283 | $8,063 | $28,220 |
| 2017 | $5,176 | $36,421 | $8,063 | $28,358 |
| 2016 | $5,018 | $36,110 | $7,684 | $28,426 |
| 2015 | $4,798 | $34,523 | $7,684 | $26,839 |
| 2013 | -- | $31,211 | $7,684 | $23,527 |
Source: Public Records
Map
Nearby Homes
- 17751 W 97th St
- 9626 Falcon Valley Dr
- 19430 W 98th St
- 19707 W 96th Terrace
- 19313 W 98th St
- 19605 W 99th St
- 0 W 95th St
- 9839 Vista Dr
- 9828 Vista Dr
- 19013 W 98th Terrace
- 19104 W 100th Terrace
- 9517 Falcon Ridge Dr
- 9625 Cailler Dr
- 18914 W 100th St
- 20306 W 99th Terrace
- 19405 W 102nd St
- 20219 W 93rd St
- 8936 Millstone Dr
- 20816 W 99th St
- 20308 W 92nd St
- 19611 W 97th Terrace
- 19603 W 97th Terrace
- 19608 W 98th St
- 19511 W 97th Terrace
- 19615 W 97th Terrace
- 19612 W 98th St
- 19604 W 98th St
- 19610 W 97th Terrace
- 19606 W 97th Terrace
- 19616 W 98th St
- 19614 W 97th Terrace
- 19507 W 97th Terrace
- 19619 W 97th Terrace
- 19602 W 97th Terrace
- 19618 W 97th Terrace
- 19620 W 98th St
- 19514 W 97th Terrace
- 19623 W 97th Terrace
- 19503 W 97th Terrace
- 19622 W 97th Terrace
Your Personal Tour Guide
Ask me questions while you tour the home.