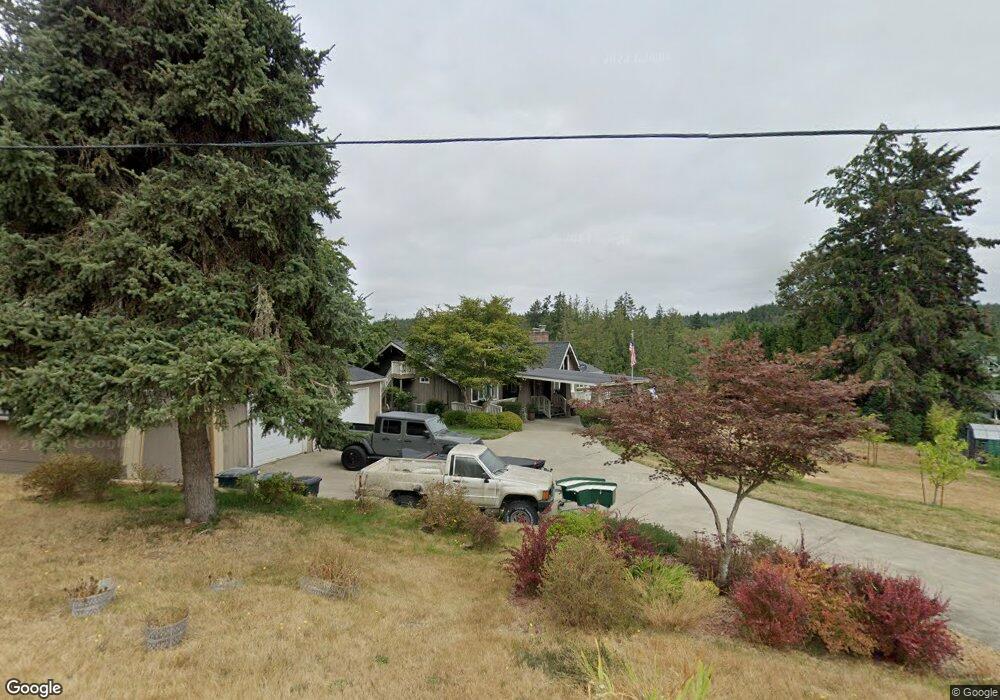
19609 Whiteman Cove Rd Longbranch, WA 98351
Estimated Value: $797,000 - $939,542
3
Beds
4
Baths
3,388
Sq Ft
$257/Sq Ft
Est. Value
About This Home
This home is located at 19609 Whiteman Cove Rd, Longbranch, WA 98351 and is currently estimated at $871,636, approximately $257 per square foot. 19609 Whiteman Cove Rd is a home located in Pierce County with nearby schools including Evergreen Elementary School, Key Peninsula Middle School, and Peninsula High School.
Ownership History
Date
Name
Owned For
Owner Type
Purchase Details
Closed on
Jun 25, 2018
Sold by
Anderson Alistair R and Mariner Elizabeth A
Bought by
Trask Charles and Trask Teresa
Current Estimated Value
Purchase Details
Closed on
Sep 22, 2015
Sold by
Kolander Mark Alan and Kolander Deborah Ann
Bought by
Anderson Alistair R and Mariner Elizabeth A
Home Financials for this Owner
Home Financials are based on the most recent Mortgage that was taken out on this home.
Original Mortgage
$200,000
Interest Rate
3.78%
Mortgage Type
New Conventional
Purchase Details
Closed on
Jun 27, 2007
Sold by
Rembert Poungtong Chinswadi
Bought by
Kolander Mark Alan and Kolander Deborah Ann
Home Financials for this Owner
Home Financials are based on the most recent Mortgage that was taken out on this home.
Original Mortgage
$425,000
Interest Rate
6.36%
Mortgage Type
Seller Take Back
Purchase Details
Closed on
Sep 3, 1997
Sold by
Rembert Charles C
Bought by
Moore Warren
Create a Home Valuation Report for This Property
The Home Valuation Report is an in-depth analysis detailing your home's value as well as a comparison with similar homes in the area
Home Values in the Area
Average Home Value in this Area
Purchase History
| Date | Buyer | Sale Price | Title Company |
|---|---|---|---|
| Trask Charles | $719,662 | Attorneys Title Of Kitsap | |
| Anderson Alistair R | $589,719 | Ticor | |
| Kolander Mark Alan | $525,000 | Ticor | |
| Moore Warren | $4,823 | Commonwealth Title Company |
Source: Public Records
Mortgage History
| Date | Status | Borrower | Loan Amount |
|---|---|---|---|
| Previous Owner | Anderson Alistair R | $200,000 | |
| Previous Owner | Kolander Mark Alan | $425,000 |
Source: Public Records
Tax History Compared to Growth
Tax History
| Year | Tax Paid | Tax Assessment Tax Assessment Total Assessment is a certain percentage of the fair market value that is determined by local assessors to be the total taxable value of land and additions on the property. | Land | Improvement |
|---|---|---|---|---|
| 2025 | $7,388 | $874,300 | $260,300 | $614,000 |
| 2024 | $7,388 | $878,400 | $260,300 | $618,100 |
| 2023 | $7,388 | $821,900 | $250,300 | $571,600 |
| 2022 | $7,657 | $839,300 | $250,300 | $589,000 |
| 2021 | $6,642 | $617,900 | $190,200 | $427,700 |
| 2019 | $5,326 | $546,300 | $150,200 | $396,100 |
| 2018 | $5,242 | $501,900 | $135,200 | $366,700 |
| 2017 | $4,906 | $442,900 | $125,200 | $317,700 |
| 2016 | $3,871 | $387,700 | $112,100 | $275,600 |
| 2014 | $4,512 | $307,800 | $98,200 | $209,600 |
| 2013 | $4,512 | $312,800 | $108,000 | $204,800 |
Source: Public Records
Map
Nearby Homes
- 19401 Whiteman Cove Rd SW
- 1111 xxxx Whiteman Rd SW
- 4901 199th Avenue Ct SW
- 7515 Whiteman Rd SW
- 0 30th St SW Unit NWM2342056
- 3912 183rd Avenue Ct SW
- 5315 Whiteman Rd SW
- 2704 196th Ave SW
- 2619 194th Ave SW
- 19518 26th Street Ct SW
- 4914 182nd Ave SW
- 2303 197th Ave SW
- 2311 202nd Ave SW
- 19617 21st Street Ct SW
- 19307 22nd Street Ct SW
- 18771 & 19789 Erickson Rd SW
- 19789 Erickson Rd SW
- 18771 Erickson Rd SW
- 2106 Lake Dr SW
- 2212 184th Ave SW
- 19609 Whiteman Cove Dr
- 19609 Whitemans Cove Road Kp S
- 19611 Whiteman Cove Rd Kps
- 19611 Whitemans Cove Road Kp S
- 19605 Whiteman Cove Rd
- 19605 Whiteman Cove Rd SW
- 19605 Whiteman Cove Rd SW
- 19605 Whiteman Cove Rd Kps
- 19605 Whitemans Cove Road Kp S
- 19615 Whiteman Cove Rd SW
- 19615 40th St
- 19705 Whitemans Cove Road Kp S
- 19605 Whitemans Cove Road Kps
- 19521 Whiteman Cove Rd SW
- 19521 Whiteman Cove Rd SW
- 19709 Whitemans Cove Road Kp S
- 19517 Whitemans Cove Road Kp S
- 19501 Whiteman Cove Rd Kps
- 19411 Whiteman Cove Rd Kps
- 19411 Whitemans Cove Road Kp S