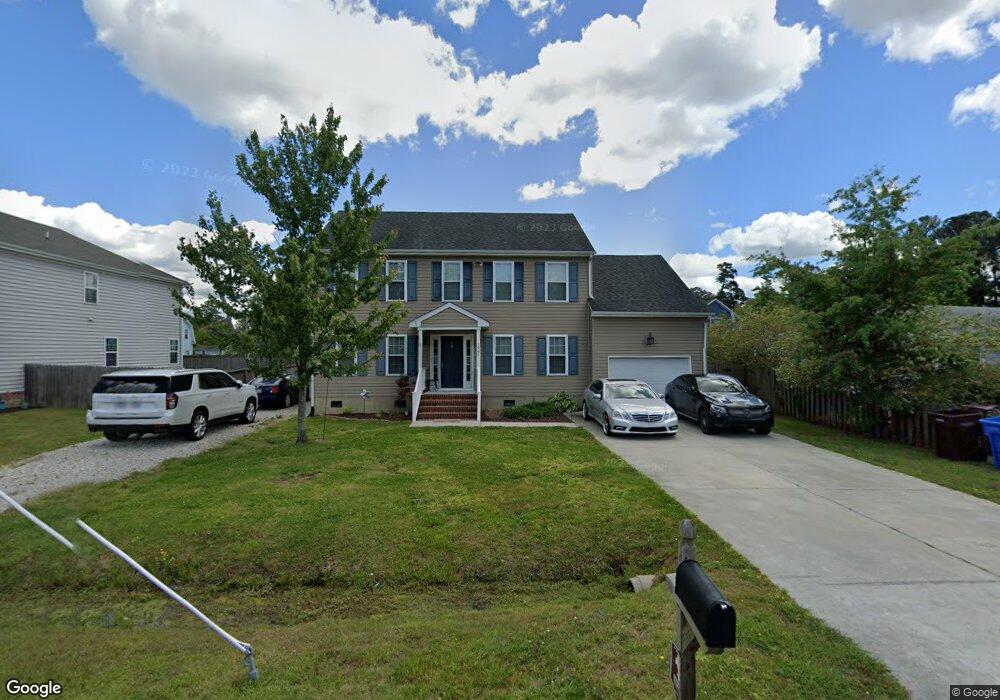
1961 Millville Rd Chesapeake, VA 23323
Deep Creek NeighborhoodEstimated Value: $525,167
4
Beds
3
Baths
2,590
Sq Ft
$203/Sq Ft
Est. Value
About This Home
This home is located at 1961 Millville Rd, Chesapeake, VA 23323 and is currently estimated at $525,167, approximately $202 per square foot. 1961 Millville Rd is a home located in Chesapeake City with nearby schools including Grassfield Elementary School, Hugo a Owens Middle, and Grassfield High School.
Ownership History
Date
Name
Owned For
Owner Type
Purchase Details
Closed on
Dec 12, 2022
Sold by
Lathrop Robert Ross
Bought by
Johnson Lanita Dee and Johnson Antonio Cortez
Current Estimated Value
Home Financials for this Owner
Home Financials are based on the most recent Mortgage that was taken out on this home.
Original Mortgage
$455,295
Outstanding Balance
$441,633
Interest Rate
6.95%
Mortgage Type
VA
Estimated Equity
$83,534
Purchase Details
Closed on
Aug 1, 2017
Sold by
Ward Matthew C and Ward Madeline G
Bought by
Lathrop Robert Ross and Lathrop Leslie A
Home Financials for this Owner
Home Financials are based on the most recent Mortgage that was taken out on this home.
Original Mortgage
$337,095
Interest Rate
3.9%
Mortgage Type
VA
Purchase Details
Closed on
Dec 13, 2011
Sold by
Reverse Mortgage Solutions Inc
Bought by
Harris Rick A
Purchase Details
Closed on
Dec 17, 2010
Sold by
Nectar Projects Inc
Bought by
Reverse Mortgage Solutions and Bank Of America
Create a Home Valuation Report for This Property
The Home Valuation Report is an in-depth analysis detailing your home's value as well as a comparison with similar homes in the area
Home Values in the Area
Average Home Value in this Area
Purchase History
| Date | Buyer | Sale Price | Title Company |
|---|---|---|---|
| Johnson Lanita Dee | $460,000 | 1St Choice Title | |
| Johnson Lanita Dee | $460,000 | 1St Choice Title | |
| Lathrop Robert Ross | $330,000 | Attorney | |
| Harris Rick A | $76,000 | -- | |
| Reverse Mortgage Solutions | $80,000 | -- |
Source: Public Records
Mortgage History
| Date | Status | Borrower | Loan Amount |
|---|---|---|---|
| Open | Johnson Lanita Dee | $455,295 | |
| Closed | Johnson Lanita Dee | $455,295 | |
| Previous Owner | Lathrop Robert Ross | $337,095 |
Source: Public Records
Tax History Compared to Growth
Tax History
| Year | Tax Paid | Tax Assessment Tax Assessment Total Assessment is a certain percentage of the fair market value that is determined by local assessors to be the total taxable value of land and additions on the property. | Land | Improvement |
|---|---|---|---|---|
| 2025 | $4,584 | $490,100 | $190,000 | $300,100 |
| 2024 | $4,584 | $472,700 | $175,000 | $297,700 |
| 2023 | $4,224 | $453,900 | $145,000 | $308,900 |
| 2022 | $4,229 | $418,700 | $135,000 | $283,700 |
| 2021 | $3,852 | $366,900 | $110,000 | $256,900 |
| 2020 | $3,732 | $355,400 | $105,000 | $250,400 |
| 2019 | $3,682 | $350,700 | $105,000 | $245,700 |
| 2018 | $3,633 | $330,400 | $105,000 | $225,400 |
| 2017 | $3,469 | $330,400 | $105,000 | $225,400 |
| 2016 | $3,417 | $325,400 | $100,000 | $225,400 |
| 2015 | $3,364 | $320,400 | $95,000 | $225,400 |
| 2014 | $3,249 | $309,400 | $90,000 | $219,400 |
Source: Public Records
Map
Nearby Homes
- 2014 Millville Rd
- 1949 Lemonwood Rd
- 1908 Mccoy Rd
- 1725 Burson Dr
- 1916 Mccoy Rd
- 1918 Mccoy Rd
- 1949 Rockwood Dr
- 1917 Mccoy Rd
- 2219 Angler Ln
- 1860 Millville Rd
- 2084 Millville Rd
- 2001 Kelsey Bay Ct
- 2000 Kelsey Bay Ct
- 1653 Shipyard Rd
- 2029 Shipyard Rd
- .181AC Shipyard Rd
- 1758 Watershed Ct
- 1928 Moses Grandy Trail
- 1857 Shipyard Rd
- 1920 Lancing Crest Ln
- 1957 Millville Rd
- 1965 Millville Rd
- 1960 Millville Rd
- 1963 Millville Rd
- 1964 Reefwood Rd
- 1962 Millville Rd
- 1956 Millville Rd
- 1947 Millville Rd
- 1968 Reefwood Rd
- 1956 Reefwood Rd
- 1964 Millville Rd
- 1973 Millville Rd
- 1952 Reefwood Rd
- 1948 Millville Rd
- 1972 Reefwood Rd
- 1945 Millville Rd
- 1972 Millville Rd
- 1944 Millville Rd
- 1948 Reefwood Rd
- 1965 Reefwood Rd