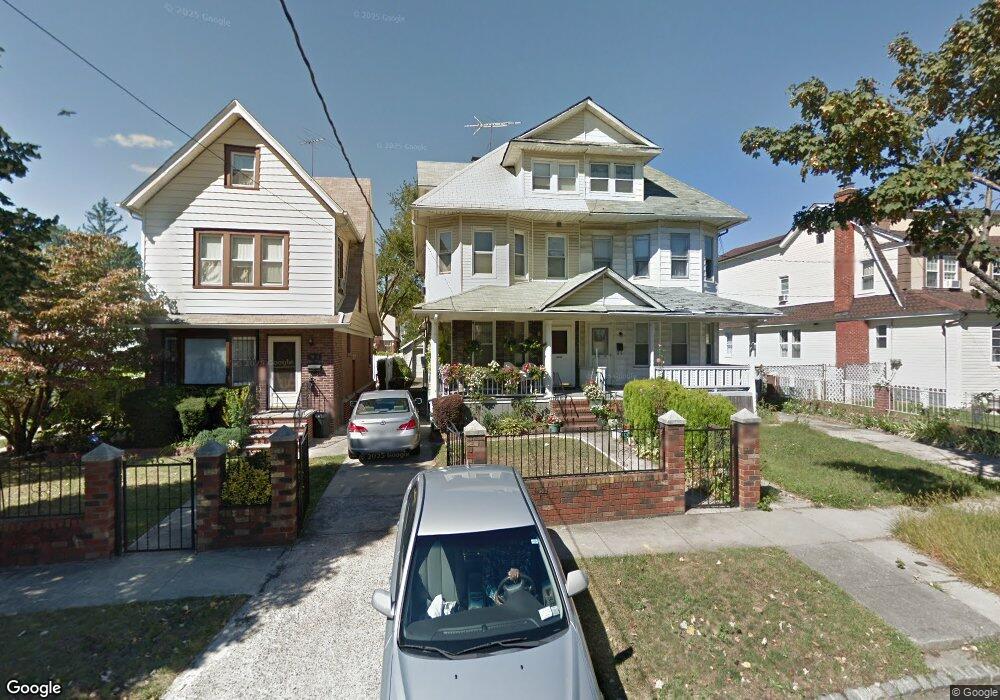
19617 89th Rd Hollis, NY 11423
Hollis NeighborhoodEstimated Value: $824,000 - $931,869
--
Bed
--
Bath
1,818
Sq Ft
$492/Sq Ft
Est. Value
About This Home
This home is located at 19617 89th Rd, Hollis, NY 11423 and is currently estimated at $894,717, approximately $492 per square foot. 19617 89th Rd is a home located in Queens County with nearby schools including P.S. 35 Nathaniel Woodhull, I.S. 238 Susan B Anthony Academy, and The Wellspring Schools.
Ownership History
Date
Name
Owned For
Owner Type
Purchase Details
Closed on
Sep 21, 2018
Sold by
Cornelius Don and Narine Dave
Bought by
Begum Menoara and Hoque Akm Emranul
Current Estimated Value
Home Financials for this Owner
Home Financials are based on the most recent Mortgage that was taken out on this home.
Original Mortgage
$492,000
Outstanding Balance
$428,169
Interest Rate
4.5%
Mortgage Type
Purchase Money Mortgage
Estimated Equity
$466,548
Purchase Details
Closed on
Dec 29, 2017
Sold by
Patricia L Patterson As Trustee
Bought by
Cornelius Don and Narine Dave
Purchase Details
Closed on
Jun 21, 2010
Sold by
Davis Eric F and Patterson Patricia L
Bought by
Patterson As Co-Trustee Patricia L and Rose, As Co-Trustee, Irving A
Purchase Details
Closed on
Mar 23, 2007
Sold by
Davis Eric
Bought by
Davis Eric F and Patterson Patricia L
Create a Home Valuation Report for This Property
The Home Valuation Report is an in-depth analysis detailing your home's value as well as a comparison with similar homes in the area
Home Values in the Area
Average Home Value in this Area
Purchase History
| Date | Buyer | Sale Price | Title Company |
|---|---|---|---|
| Begum Menoara | $615,000 | -- | |
| Cornelius Don | $475,000 | -- | |
| Patterson As Co-Trustee Patricia L | -- | -- | |
| Davis Eric F | -- | -- |
Source: Public Records
Mortgage History
| Date | Status | Borrower | Loan Amount |
|---|---|---|---|
| Open | Begum Menoara | $492,000 |
Source: Public Records
Tax History Compared to Growth
Tax History
| Year | Tax Paid | Tax Assessment Tax Assessment Total Assessment is a certain percentage of the fair market value that is determined by local assessors to be the total taxable value of land and additions on the property. | Land | Improvement |
|---|---|---|---|---|
| 2025 | $5,958 | $31,420 | $9,960 | $21,460 |
| 2024 | $5,958 | $29,665 | $10,619 | $19,046 |
| 2023 | $5,699 | $28,373 | $8,635 | $19,738 |
| 2022 | $5,407 | $44,160 | $15,120 | $29,040 |
| 2021 | $5,700 | $37,800 | $15,120 | $22,680 |
| 2020 | $5,542 | $36,360 | $15,120 | $21,240 |
| 2019 | $5,171 | $34,380 | $15,120 | $19,260 |
| 2018 | $4,946 | $23,644 | $10,014 | $13,630 |
| 2016 | $3,891 | $22,572 | $11,088 | $11,484 |
| 2015 | $2,130 | $21,819 | $13,195 | $8,624 |
| 2014 | $2,130 | $20,601 | $12,622 | $7,979 |
Source: Public Records
Map
Nearby Homes
- 89-48 196th St
- 88-27 196th St
- 90-35 198th St
- 88-38 201st St
- 196-33 Foothill Ave
- 19633 Foothill Ave
- 8925 201st St
- 88-44 202nd St
- 92-22 195th Place
- 196-35 Dunton Ave Unit 1
- 88-49 202nd St
- 9051 201st St
- 9141 195th St
- 87-44 Marengo St Unit 2A
- 19515 Woodhull Ave
- 19511 Woodhull Ave
- 87-24 Marengo St Unit 2B
- 191-13 Jamaica Ave
- 9317 197th St
- 87-16 Marengo St Unit 2B