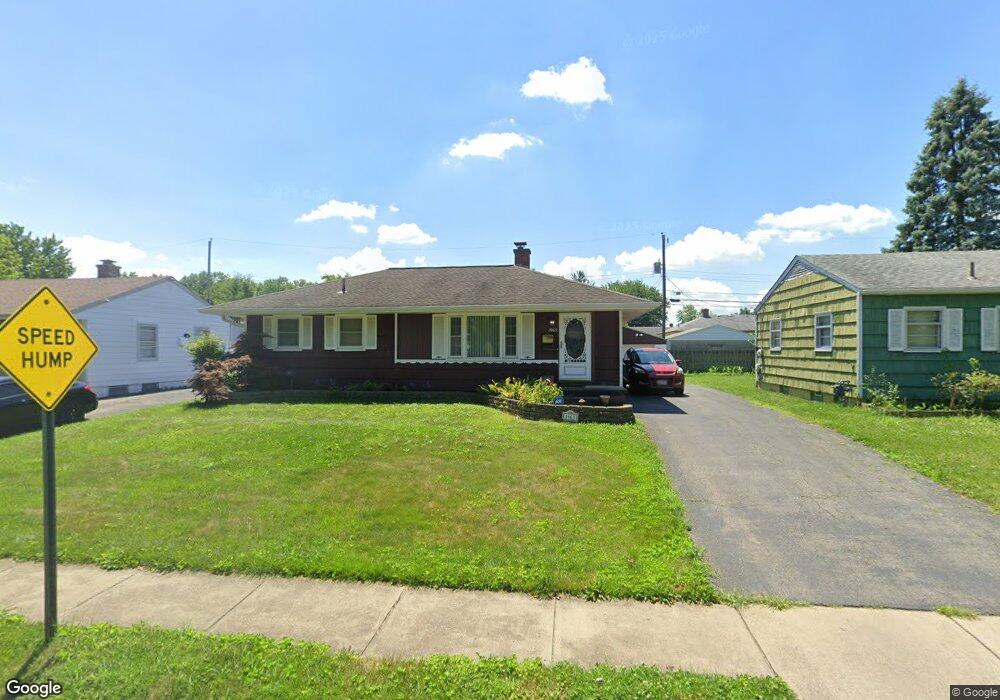
1963 Fenton St Columbus, OH 43224
North Linden NeighborhoodEstimated Value: $190,527 - $224,000
3
Beds
1
Bath
900
Sq Ft
$231/Sq Ft
Est. Value
About This Home
This home is located at 1963 Fenton St, Columbus, OH 43224 and is currently estimated at $207,882, approximately $230 per square foot. 1963 Fenton St is a home located in Franklin County with nearby schools including North Linden Elementary School, Medina Middle School, and Mifflin High School.
Ownership History
Date
Name
Owned For
Owner Type
Purchase Details
Closed on
Oct 22, 1999
Sold by
Federer Patricia A and Henthorn Steven L
Bought by
Mitchell Bradley J and Mitchell Krista J
Current Estimated Value
Home Financials for this Owner
Home Financials are based on the most recent Mortgage that was taken out on this home.
Original Mortgage
$72,648
Outstanding Balance
$22,070
Interest Rate
7.91%
Mortgage Type
FHA
Estimated Equity
$185,812
Purchase Details
Closed on
Dec 22, 1993
Bought by
Federer Patricia A
Create a Home Valuation Report for This Property
The Home Valuation Report is an in-depth analysis detailing your home's value as well as a comparison with similar homes in the area
Home Values in the Area
Average Home Value in this Area
Purchase History
| Date | Buyer | Sale Price | Title Company |
|---|---|---|---|
| Mitchell Bradley J | $79,900 | Chicago Title | |
| Federer Patricia A | $67,800 | -- |
Source: Public Records
Mortgage History
| Date | Status | Borrower | Loan Amount |
|---|---|---|---|
| Open | Mitchell Bradley J | $72,648 |
Source: Public Records
Tax History Compared to Growth
Tax History
| Year | Tax Paid | Tax Assessment Tax Assessment Total Assessment is a certain percentage of the fair market value that is determined by local assessors to be the total taxable value of land and additions on the property. | Land | Improvement |
|---|---|---|---|---|
| 2024 | $2,330 | $51,910 | $12,250 | $39,660 |
| 2023 | $2,300 | $51,910 | $12,250 | $39,660 |
| 2022 | $1,269 | $24,470 | $5,500 | $18,970 |
| 2021 | $1,271 | $24,470 | $5,500 | $18,970 |
| 2020 | $1,273 | $24,470 | $5,500 | $18,970 |
| 2019 | $1,153 | $19,010 | $4,410 | $14,600 |
| 2018 | $1,249 | $19,010 | $4,410 | $14,600 |
| 2017 | $1,153 | $19,010 | $4,410 | $14,600 |
| 2016 | $1,485 | $22,410 | $4,100 | $18,310 |
| 2015 | $1,348 | $22,410 | $4,100 | $18,310 |
| 2014 | $1,351 | $22,410 | $4,100 | $18,310 |
| 2013 | $740 | $24,885 | $4,550 | $20,335 |
Source: Public Records
Map
Nearby Homes
- 4111 Walford St
- 1863 Ward Rd
- 4217 Hickman Rd
- 4309 Walford St
- 1997 Ferris Rd
- 2144 Colfax Ave
- 2023 Ferris Rd
- 1734 Ferris Rd
- 1936 Case Rd
- 2194 Ashley Dr
- 1896 Ormond Ave
- 2220 Sale Rd
- 4057 Estates Place
- 2283 Ward Rd
- 2219 Sale Rd
- 3750 Dresden St
- 4090 Cleveland Ave
- 4143 Karl Rd Unit 314
- 4145 Karl Rd Unit 223
- 2015 Melrose Ave
- 1971 Fenton St
- 1959 Fenton St
- 1962 E Beaumont Rd
- 1970 E Beaumont Rd
- 1954 E Beaumont Rd
- 1977 Fenton St
- 1949 Fenton St
- 1968 Fenton St
- 1976 E Beaumont Rd
- 1946 E Beaumont Rd
- 1962 Fenton St
- 1976 Fenton St
- 1985 Fenton St
- 1939 Fenton St
- 1954 Fenton St
- 1984 Fenton St
- 1986 E Beaumont Rd
- 1938 E Beaumont Rd
- 1946 Fenton St
- 1993 Fenton St