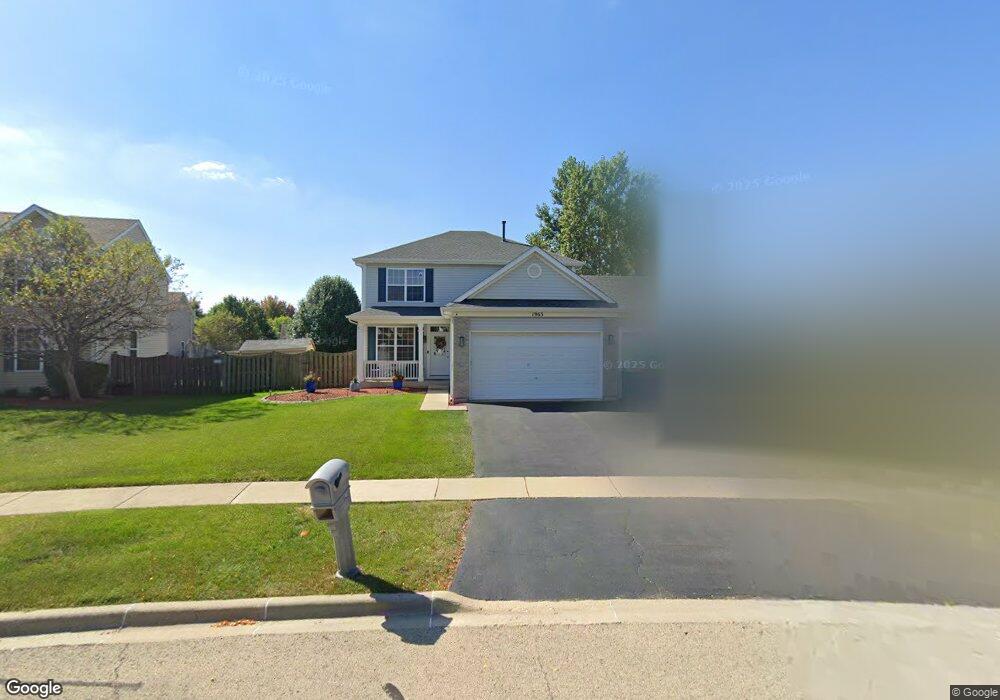
1963 W Brimstone Rd Romeoville, IL 60446
Fieldstone-Mistwood NeighborhoodEstimated Value: $409,396 - $428,000
4
Beds
3
Baths
2,176
Sq Ft
$192/Sq Ft
Est. Value
About This Home
This home is located at 1963 W Brimstone Rd, Romeoville, IL 60446 and is currently estimated at $417,099, approximately $191 per square foot. 1963 W Brimstone Rd is a home located in Will County with nearby schools including Richard Ira Jones Middle School, Plainfield North High School, and Little Explorers Christian Montessori School.
Ownership History
Date
Name
Owned For
Owner Type
Purchase Details
Closed on
Mar 12, 2008
Sold by
Kothari Hasmukh and Singh Nirmal
Bought by
Flores Angel and Flores Mary
Current Estimated Value
Home Financials for this Owner
Home Financials are based on the most recent Mortgage that was taken out on this home.
Original Mortgage
$277,000
Outstanding Balance
$172,567
Interest Rate
5.74%
Mortgage Type
Purchase Money Mortgage
Estimated Equity
$244,532
Purchase Details
Closed on
Sep 7, 2007
Sold by
Hud
Bought by
Kothari Hasmukh and Singh Nirmal
Purchase Details
Closed on
Apr 25, 2007
Sold by
Bogacz Rebecca A and Mid America Bank Fsb
Bought by
Hud
Purchase Details
Closed on
May 1, 2004
Sold by
Pasquinelli Fieldstone Llc
Bought by
Bogacz Rebecca A
Home Financials for this Owner
Home Financials are based on the most recent Mortgage that was taken out on this home.
Original Mortgage
$226,686
Interest Rate
4.12%
Mortgage Type
FHA
Create a Home Valuation Report for This Property
The Home Valuation Report is an in-depth analysis detailing your home's value as well as a comparison with similar homes in the area
Home Values in the Area
Average Home Value in this Area
Purchase History
| Date | Buyer | Sale Price | Title Company |
|---|---|---|---|
| Flores Angel | $277,000 | Preferred Title Ins Agency | |
| Kothari Hasmukh | -- | Stewart Title Company | |
| Hud | -- | None Available | |
| Bogacz Rebecca A | $235,000 | Chicago Title Insurance Co |
Source: Public Records
Mortgage History
| Date | Status | Borrower | Loan Amount |
|---|---|---|---|
| Open | Flores Angel | $277,000 | |
| Previous Owner | Bogacz Rebecca A | $226,686 |
Source: Public Records
Tax History Compared to Growth
Tax History
| Year | Tax Paid | Tax Assessment Tax Assessment Total Assessment is a certain percentage of the fair market value that is determined by local assessors to be the total taxable value of land and additions on the property. | Land | Improvement |
|---|---|---|---|---|
| 2024 | $8,292 | $110,568 | $22,991 | $87,577 |
| 2023 | $8,292 | $99,863 | $20,765 | $79,098 |
| 2022 | $7,867 | $94,939 | $20,515 | $74,424 |
| 2021 | $7,421 | $88,728 | $19,173 | $69,555 |
| 2020 | $7,329 | $86,211 | $18,629 | $67,582 |
| 2019 | $7,004 | $82,144 | $17,750 | $64,394 |
| 2018 | $6,681 | $77,178 | $16,677 | $60,501 |
| 2017 | $6,481 | $73,342 | $15,848 | $57,494 |
| 2016 | $6,318 | $69,950 | $15,115 | $54,835 |
| 2015 | $5,992 | $65,527 | $14,159 | $51,368 |
| 2014 | $5,992 | $63,213 | $13,659 | $49,554 |
| 2013 | $5,992 | $63,213 | $13,659 | $49,554 |
Source: Public Records
Map
Nearby Homes
- 1973 W Crestview Cir
- 1986 W Brimstone Rd Unit 1
- 514 S Stone Bluff Dr
- 2033 Wedgewood Cir
- 357 Wedgewood Cir
- 2057 W Helen Dr
- 1843 S Wentworth Cir
- 1796 S Wentworth Cir
- 2076 Whitmore Dr
- 351 Richmond Dr
- 251 Summerfield Dr
- 1852 Sierra Trail
- 195 Morgan Ct
- 2075 Longwood Ct
- 2076 Longwood Ct Unit 1
- 249 Gladiolus Dr
- 337 Daffodil Dr Unit 3
- 142 Sedgewicke Dr
- 1611 Benzie Cir Unit 1
- 669 Bridgeman Ln Unit 1
- 1961 W Brimstone Rd Unit 1
- 1965 W Brimstone Rd Unit 1
- 1972 W Ashbrooke Rd Unit 1
- 1978 W Ashbrooke Rd
- 1957 W Brimstone Rd
- 491 S Windcrest Dr
- 1968 W Ashbrooke Rd
- 1967 W Brimstone Rd Unit 1
- 1964 W Brimstone Rd
- 487 S Windcrest Dr
- 1984 W Ashbrooke Rd
- 1962 W Ashbrooke Rd
- 1958 W Brimstone Rd
- 1955 W Brimstone Rd
- 481 S Windcrest Dr
- 1971 W Brimstone Rd
- 1968 W Brimstone Rd
- 1954 W Brimstone Rd
- 477 S Windcrest Dr
- 1958 W Ashbrooke Rd Unit 1