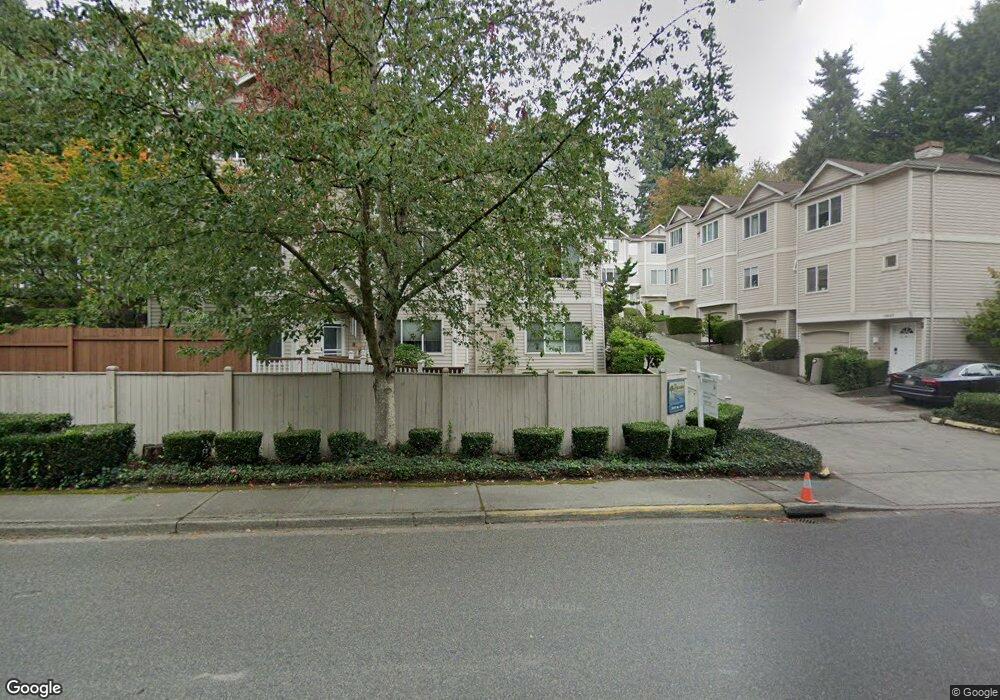
19633 15th Ave NE Unit 3 Shoreline, WA 98155
Ballinger NeighborhoodEstimated Value: $416,000 - $462,000
2
Beds
3
Baths
1,236
Sq Ft
$362/Sq Ft
Est. Value
About This Home
This home is located at 19633 15th Ave NE Unit 3, Shoreline, WA 98155 and is currently estimated at $448,012, approximately $362 per square foot. 19633 15th Ave NE Unit 3 is a home located in King County with nearby schools including Ridgecrest Elementary School, Kellogg Middle School, and Shorecrest High School.
Ownership History
Date
Name
Owned For
Owner Type
Purchase Details
Closed on
Aug 20, 2014
Sold by
Hay Sunthareach Richy and Hay Tricia Seah
Bought by
Sargent Kenneth C and Sargent Gloria H
Current Estimated Value
Home Financials for this Owner
Home Financials are based on the most recent Mortgage that was taken out on this home.
Original Mortgage
$148,000
Outstanding Balance
$112,850
Interest Rate
4.11%
Estimated Equity
$335,162
Purchase Details
Closed on
Nov 13, 2002
Sold by
Wilson Edward R
Bought by
Hay Sunthareach R and Hay Tricia S
Home Financials for this Owner
Home Financials are based on the most recent Mortgage that was taken out on this home.
Original Mortgage
$146,000
Interest Rate
5.95%
Purchase Details
Closed on
Jun 20, 2000
Sold by
Bray Steve M
Bought by
Wilson Edward R
Home Financials for this Owner
Home Financials are based on the most recent Mortgage that was taken out on this home.
Original Mortgage
$164,400
Interest Rate
8.53%
Purchase Details
Closed on
Nov 23, 1992
Sold by
Juel Randolph W and Juel Cindee L
Bought by
Bray Steve M
Create a Home Valuation Report for This Property
The Home Valuation Report is an in-depth analysis detailing your home's value as well as a comparison with similar homes in the area
Home Values in the Area
Average Home Value in this Area
Purchase History
| Date | Buyer | Sale Price | Title Company |
|---|---|---|---|
| Sargent Kenneth C | $185,000 | Stewart Title | |
| Hay Sunthareach R | $182,500 | Fidelity National Title | |
| Wilson Edward R | $161,000 | Chicago Title Insurance Co | |
| Bray Steve M | $116,500 | -- |
Source: Public Records
Mortgage History
| Date | Status | Borrower | Loan Amount |
|---|---|---|---|
| Open | Sargent Kenneth C | $148,000 | |
| Previous Owner | Hay Sunthareach R | $146,000 | |
| Previous Owner | Wilson Edward R | $164,400 |
Source: Public Records
Tax History Compared to Growth
Tax History
| Year | Tax Paid | Tax Assessment Tax Assessment Total Assessment is a certain percentage of the fair market value that is determined by local assessors to be the total taxable value of land and additions on the property. | Land | Improvement |
|---|---|---|---|---|
| 2024 | $1,635 | $394,000 | $101,300 | $292,700 |
| 2023 | $4,384 | $446,000 | $108,100 | $337,900 |
| 2022 | $3,821 | $410,000 | $94,600 | $315,400 |
| 2021 | $3,980 | $319,000 | $85,600 | $233,400 |
| 2020 | $3,833 | $305,000 | $85,600 | $219,400 |
| 2018 | $3,144 | $287,000 | $76,500 | $210,500 |
| 2017 | $2,584 | $244,000 | $76,500 | $167,500 |
| 2016 | $2,551 | $210,000 | $74,300 | $135,700 |
| 2015 | $2,390 | $200,000 | $67,500 | $132,500 |
| 2014 | -- | $179,000 | $78,800 | $100,200 |
| 2013 | -- | $148,000 | $78,800 | $69,200 |
Source: Public Records
Map
Nearby Homes
- 1518 NE 195th St
- 1126 NE 197th Ct
- 20101 14th Ave NE Unit 1
- 194 Xx Forest Park Dr NE
- 2224 NE 197th Place
- 821 NE 195th St
- 19230 Forest Park Dr NE Unit K335
- 19230 Forest Park Dr NE Unit H126
- 19230 Forest Park Dr NE Unit J131
- 20301 19th Ave NE Unit 1101
- 18800 15th Ave NE
- 19851 25th Ave NE Unit 204
- 19855 25th Ave NE Unit 206
- 18926 5th Ave NE
- 18916 5th Ave NE
- 24222 54th Ave W Unit 19
- 18516 8th Ave NE
- 18510 8th Ave NE
- 1823 NE 185th St
- 18504 8th Ave NE
- 19633 15th Ave NE
- 19629 15th Ave NE Unit 1
- 19629 15th Ave NE
- 19631 15th Ave NE Unit 1
- 19631 15th Ave NE Unit C14
- 19631 15th Ave NE Unit A2
- 19631 15th Ave NE Unit D16
- 19631 15th Ave NE Unit B5
- 19631 15th Ave NE Unit D15
- 19631 15th Ave NE Unit B9
- 19631 15th Ave NE Unit C13
- 19631 15th Ave NE Unit C12
- 19631 15th Ave NE Unit C11
- 19631 15th Ave NE Unit B10
- 19631 15th Ave NE Unit B8
- 19631 15th Ave NE Unit B7
- 19631 15th Ave NE Unit B6
- 19631 15th Ave NE Unit A4
- 19631 15th Ave NE Unit A3
- 19631 15th Ave NE Unit A1