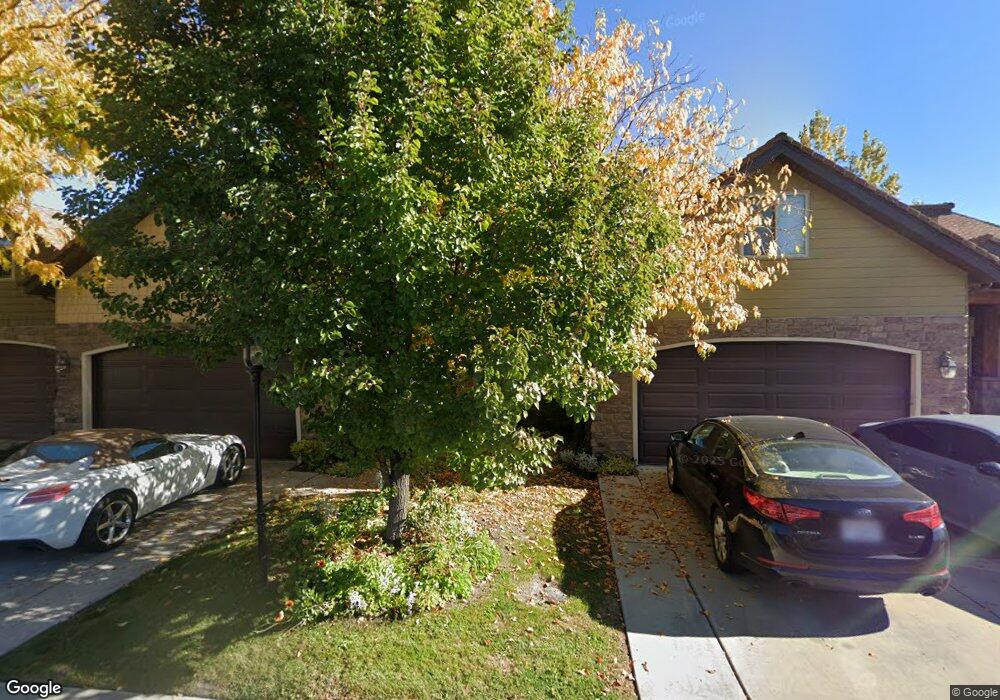
1964 W Golden Pond Way Orem, UT 84058
Sunset Heights NeighborhoodEstimated Value: $460,000 - $490,464
3
Beds
3
Baths
1,826
Sq Ft
$263/Sq Ft
Est. Value
About This Home
This home is located at 1964 W Golden Pond Way, Orem, UT 84058 and is currently estimated at $479,616, approximately $262 per square foot. 1964 W Golden Pond Way is a home located in Utah County with nearby schools including Vineyard Elementary School, Lakeridge Jr High School, and Mountain View High School.
Ownership History
Date
Name
Owned For
Owner Type
Purchase Details
Closed on
Oct 26, 2010
Sold by
Federal Home Loan Mortgage Corporation
Bought by
Lindsay Jeff
Current Estimated Value
Home Financials for this Owner
Home Financials are based on the most recent Mortgage that was taken out on this home.
Original Mortgage
$186,488
Outstanding Balance
$123,418
Interest Rate
4.33%
Mortgage Type
FHA
Estimated Equity
$356,198
Purchase Details
Closed on
Jul 28, 2010
Sold by
Bac Home Loans Servicing Lp
Bought by
Federal Home Loan Mortgage Corp
Purchase Details
Closed on
May 2, 2007
Sold by
Sequoia Builders Llc
Bought by
Thelin Jade A
Home Financials for this Owner
Home Financials are based on the most recent Mortgage that was taken out on this home.
Original Mortgage
$65,750
Interest Rate
6.14%
Mortgage Type
Stand Alone Second
Create a Home Valuation Report for This Property
The Home Valuation Report is an in-depth analysis detailing your home's value as well as a comparison with similar homes in the area
Home Values in the Area
Average Home Value in this Area
Purchase History
| Date | Buyer | Sale Price | Title Company |
|---|---|---|---|
| Lindsay Jeff | -- | Bonneville Superior Title C | |
| Federal Home Loan Mortgage Corp | -- | Accommodation | |
| Bac Home Loans Servicing Lp | $209,725 | Lsi Title Agency Inc | |
| Thelin Jade A | -- | Merrill Title Company | |
| Sequoia Builders Llc | -- | Merrill Title Company |
Source: Public Records
Mortgage History
| Date | Status | Borrower | Loan Amount |
|---|---|---|---|
| Open | Lindsay Jeff | $186,488 | |
| Previous Owner | Sequoia Builders Llc | $65,750 | |
| Previous Owner | Thelin Jade A | $263,100 |
Source: Public Records
Tax History Compared to Growth
Tax History
| Year | Tax Paid | Tax Assessment Tax Assessment Total Assessment is a certain percentage of the fair market value that is determined by local assessors to be the total taxable value of land and additions on the property. | Land | Improvement |
|---|---|---|---|---|
| 2025 | $2,019 | $254,430 | $68,000 | $394,600 |
| 2024 | $2,019 | $246,840 | $0 | $0 |
| 2023 | $1,834 | $241,010 | $0 | $0 |
| 2022 | $1,927 | $245,300 | $0 | $0 |
| 2021 | $1,739 | $335,300 | $50,300 | $285,000 |
| 2020 | $1,631 | $309,100 | $46,400 | $262,700 |
| 2019 | $1,568 | $309,100 | $46,400 | $262,700 |
| 2018 | $1,259 | $237,100 | $35,600 | $201,500 |
| 2017 | $1,293 | $130,405 | $0 | $0 |
| 2016 | $1,212 | $112,750 | $0 | $0 |
| 2015 | $1,282 | $112,750 | $0 | $0 |
| 2014 | $1,124 | $98,450 | $0 | $0 |
Source: Public Records
Map
Nearby Homes
- 1959 W Golden Pond Way
- 894 S 2100 W
- 866 S Pheasant Run Dr
- 1909 W Golden Pond Way
- 825 S Pheasant Run
- 780 S 1840 W
- 2139 W 980 S
- 1771 W 850 S
- 917 S 1675 W
- 1989 W 475 S
- 167 E Lake View Dr
- 583 E Parker Place
- 1566 W 650 S
- 1463 W 730 S
- 662 S 1490 W
- 481 S Main St Unit Lot 139
- 12 W Stillwater St Unit 148
- 473 S Main St Unit 138
- 16 W Stillwater St Unit 150
- 338 S Holdaway Rd
- 1968 W Golden Pond Way
- 1960 W Golden Pond Way
- 1972 W Golden Pond Way
- 1956 W Golden Pond Way
- 1990 W Golden Pond Way
- 1963 W Golden Pond Way
- 1952 W Golden Pond Way
- 1994 W Golden Pond Way
- 1957 W Golden Pond Way
- 1948 W Golden Pond Way
- 1998 W Golden Pond Way
- 1953 W Golden Pond Way
- 1944 W Golden Pond Way
- 2002 W Golden Pond Way
- 1949 W Golden Pond Way
- 2009 W Golden Pond Way
- 1945 W Golden Pond Way
- 1938 W Golden Pond Way
- 2024 W Golden Pond Way
- 1945 W Golden Pond Way