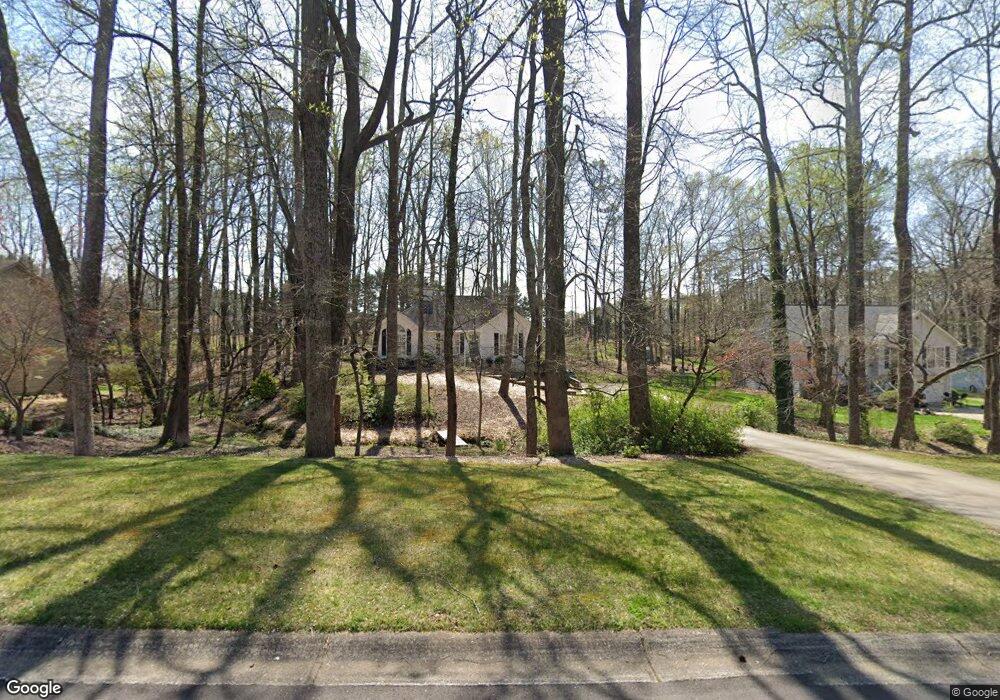
1965 Chadwick Dr Unit 31 Cumming, GA 30028
Estimated Value: $401,000 - $418,000
4
Beds
3
Baths
1,781
Sq Ft
$229/Sq Ft
Est. Value
About This Home
This home is located at 1965 Chadwick Dr Unit 31, Cumming, GA 30028 and is currently estimated at $408,127, approximately $229 per square foot. 1965 Chadwick Dr Unit 31 is a home located in Forsyth County with nearby schools including Sawnee Elementary School, Otwell Middle School, and Forsyth Central High School.
Ownership History
Date
Name
Owned For
Owner Type
Purchase Details
Closed on
Nov 9, 2017
Bought by
Thr Georgia Lp
Current Estimated Value
Purchase Details
Closed on
Aug 14, 2014
Sold by
Thr Georgia Lp
Bought by
2014 2 Ih Borrower Lp
Purchase Details
Closed on
Mar 19, 2013
Sold by
Mize Cecil S
Bought by
Thr Georgia Lp
Purchase Details
Closed on
Sep 27, 2004
Sold by
Willingham Leslie B
Bought by
Mize Cecil S and Mize Alex
Home Financials for this Owner
Home Financials are based on the most recent Mortgage that was taken out on this home.
Original Mortgage
$133,600
Interest Rate
5%
Mortgage Type
New Conventional
Purchase Details
Closed on
Apr 11, 2003
Sold by
Mckinney Angela M
Bought by
Buice Leslie
Home Financials for this Owner
Home Financials are based on the most recent Mortgage that was taken out on this home.
Original Mortgage
$116,000
Interest Rate
3.13%
Mortgage Type
New Conventional
Create a Home Valuation Report for This Property
The Home Valuation Report is an in-depth analysis detailing your home's value as well as a comparison with similar homes in the area
Home Values in the Area
Average Home Value in this Area
Purchase History
| Date | Buyer | Sale Price | Title Company |
|---|---|---|---|
| Thr Georgia Lp | -- | -- | |
| 2014 2 Ih Borrower Lp | -- | -- | |
| Thr Georgia Lp | $143,000 | -- | |
| Mize Cecil S | $167,000 | -- | |
| Buice Leslie | $145,000 | -- |
Source: Public Records
Mortgage History
| Date | Status | Borrower | Loan Amount |
|---|---|---|---|
| Previous Owner | Mize Cecil S | $133,600 | |
| Previous Owner | Buice Leslie | $116,000 |
Source: Public Records
Tax History Compared to Growth
Tax History
| Year | Tax Paid | Tax Assessment Tax Assessment Total Assessment is a certain percentage of the fair market value that is determined by local assessors to be the total taxable value of land and additions on the property. | Land | Improvement |
|---|---|---|---|---|
| 2025 | $3,790 | $154,560 | $48,000 | $106,560 |
| 2024 | $3,790 | $154,560 | $48,000 | $106,560 |
| 2023 | $3,588 | $145,776 | $40,000 | $105,776 |
| 2022 | $2,820 | $86,904 | $22,000 | $64,904 |
| 2021 | $2,400 | $86,904 | $22,000 | $64,904 |
| 2020 | $2,400 | $86,904 | $22,000 | $64,904 |
| 2019 | $2,403 | $86,904 | $22,000 | $64,904 |
| 2018 | $2,002 | $72,380 | $22,000 | $50,380 |
| 2017 | $1,941 | $69,936 | $22,000 | $47,936 |
| 2016 | $1,941 | $69,936 | $22,000 | $47,936 |
| 2015 | $1,771 | $63,696 | $18,000 | $45,696 |
| 2014 | $1,514 | $57,192 | $0 | $0 |
Source: Public Records
Map
Nearby Homes
- 1565 Dr Bramblett Rd
- 2795 Roper Rd
- 1735 Gordon Rd
- 2615 Yellowstone Farm Dr
- 2725 Yellowstone Farm Dr
- 2755 Marie Way
- 5340 Memento Trace
- 2765 Marie Way
- 2775 Marie Way
- 2610 Misty Hollow Ln
- 2165 Robin Hood Trail
- 2275 Doctor Bramblett Rd
- 1210 Magnolia Park Cir
- 4900 Spot Rd
- 1009 Canton Hwy
- 1850 Overlook Springs Ln
- 3285 Stock Saddle Place
- 1965 Chadwick Dr Unit 1965
- 1965 Chadwick Dr
- 1955 Chadwick Dr
- 1975 Chadwick Dr
- 1985 Chadwick Dr
- 1945 Chadwick Dr
- 0 Chadwick Dr Unit 8727418
- 0 Chadwick Dr Unit 8244419
- 0 Chadwick Dr Unit 7266802
- 0 Chadwick Dr Unit 7207983
- 0 Chadwick Dr Unit 7096931
- 0 Chadwick Dr Unit 7082564
- 0 Chadwick Dr Unit 8752189
- 0 Chadwick Dr Unit 8756461
- 0 Chadwick Dr Unit 8855975
- 0 Chadwick Dr Unit 8945887
- 0 Chadwick Dr Unit 3079166
- 0 Chadwick Dr Unit 3142909
- 0 Chadwick Dr Unit 3213684
- 0 Chadwick Dr Unit 3276673