Estimated Value: $216,000 - $280,246
3
Beds
2
Baths
1,931
Sq Ft
$130/Sq Ft
Est. Value
About This Home
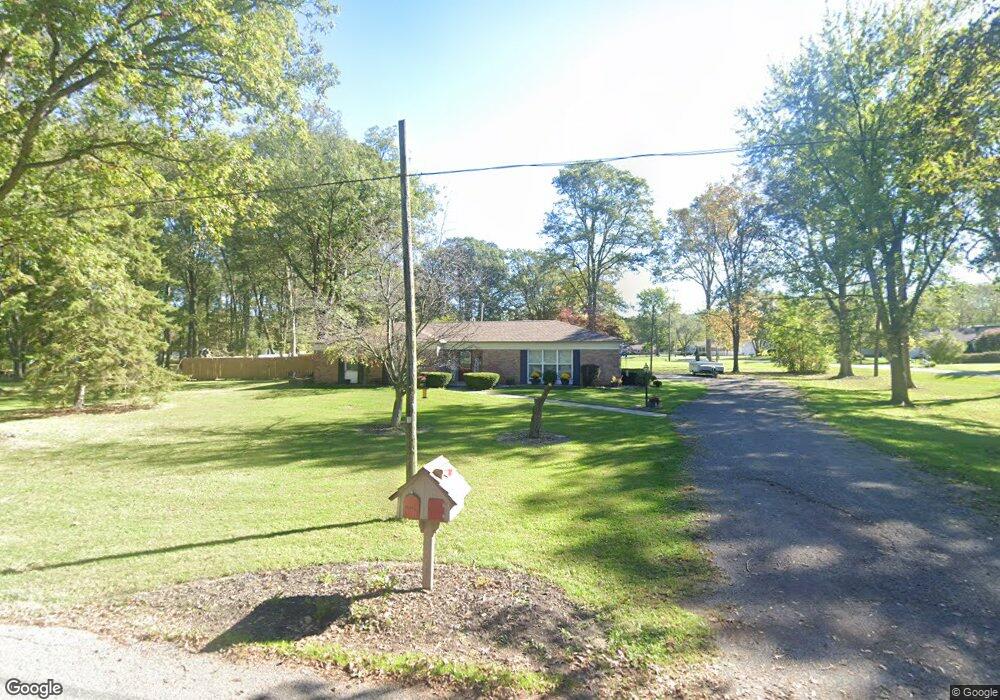
This home is located at 1965 Lorain Dr, Lima, OH 45805 and is currently estimated at $250,312, approximately $129 per square foot. 1965 Lorain Dr is a home located in Allen County with nearby schools including Maplewood Elementary School, Elmwood Elementary School, and Shawnee Middle School.
Ownership History
Date
Name
Owned For
Owner Type
Purchase Details
Closed on
Jul 31, 2012
Sold by
Esmonde Frances I
Bought by
Ruff Michael and Ruff Elizabeth
Current Estimated Value
Home Financials for this Owner
Home Financials are based on the most recent Mortgage that was taken out on this home.
Original Mortgage
$102,400
Outstanding Balance
$70,871
Interest Rate
3.65%
Mortgage Type
VA
Estimated Equity
$179,441
Purchase Details
Closed on
Nov 24, 2008
Sold by
Secretary Of Housing & Urban Development
Bought by
Esmonde Frances I
Purchase Details
Closed on
Jun 18, 2008
Sold by
Kline Jennifer L and Kline Robert S
Bought by
Hud
Purchase Details
Closed on
May 11, 2006
Sold by
Godsey Gail C and Johnson Greg
Bought by
Kline Jennifer L
Home Financials for this Owner
Home Financials are based on the most recent Mortgage that was taken out on this home.
Original Mortgage
$155,755
Interest Rate
6.39%
Mortgage Type
FHA
Purchase Details
Closed on
Feb 1, 1983
Bought by
Ruben Barry A
Create a Home Valuation Report for This Property
The Home Valuation Report is an in-depth analysis detailing your home's value as well as a comparison with similar homes in the area
Purchase History
| Date | Buyer | Sale Price | Title Company |
|---|---|---|---|
| Ruff Michael | $100,000 | Attorney | |
| Esmonde Frances I | $51,000 | Lakeside Title & Escrow Agen | |
| Hud | $100,000 | Attorney | |
| Kline Jennifer L | $158,200 | None Available | |
| Ruben Barry A | $109,000 | -- |
Source: Public Records
Mortgage History
| Date | Status | Borrower | Loan Amount |
|---|---|---|---|
| Open | Ruff Michael | $102,400 | |
| Previous Owner | Kline Jennifer L | $155,755 |
Source: Public Records
Tax History
| Year | Tax Paid | Tax Assessment Tax Assessment Total Assessment is a certain percentage of the fair market value that is determined by local assessors to be the total taxable value of land and additions on the property. | Land | Improvement |
|---|---|---|---|---|
| 2024 | $2,945 | $59,790 | $19,640 | $40,150 |
| 2023 | $3,229 | $51,560 | $16,940 | $34,620 |
| 2022 | $3,203 | $56,780 | $15,230 | $41,550 |
| 2021 | $3,224 | $56,780 | $15,230 | $41,550 |
| 2020 | $2,738 | $42,150 | $14,600 | $27,550 |
| 2019 | $2,738 | $42,150 | $14,600 | $27,550 |
| 2018 | $2,334 | $42,150 | $14,600 | $27,550 |
| 2017 | $2,422 | $37,560 | $14,600 | $22,960 |
| 2016 | $2,187 | $37,560 | $14,600 | $22,960 |
| 2015 | $2,804 | $37,560 | $14,600 | $22,960 |
| 2014 | $2,804 | $43,090 | $14,910 | $28,180 |
| 2013 | $2,445 | $43,090 | $14,910 | $28,180 |
Source: Public Records
Map
Nearby Homes
- 4211 Fort Amanda Rd
- 2905 Oak Hill Ct
- 4475 Wintergreen Dr
- 3039 Lakeshore Dr
- 3020 Lakeshore Dr
- 2977 Pine Grove Way
- 4039 Magnolia
- 4268 Blue Spruce Ln
- 3441 Winston Ln
- 3829 Meadowview Dr
- 2529 Struthmore Dr
- 2340 S Wapak Rd
- 1602 Wonderlick Rd
- 4190 Emma Pkwy
- 3650 Redbud Ln
- 3939 Odema Dr
- 2632 Alexandria Dr
- 115 Lanes End
- 2160 Grimmwood Dr
- 2970 Sands Rd
Your Personal Tour Guide
Ask me questions while you tour the home.