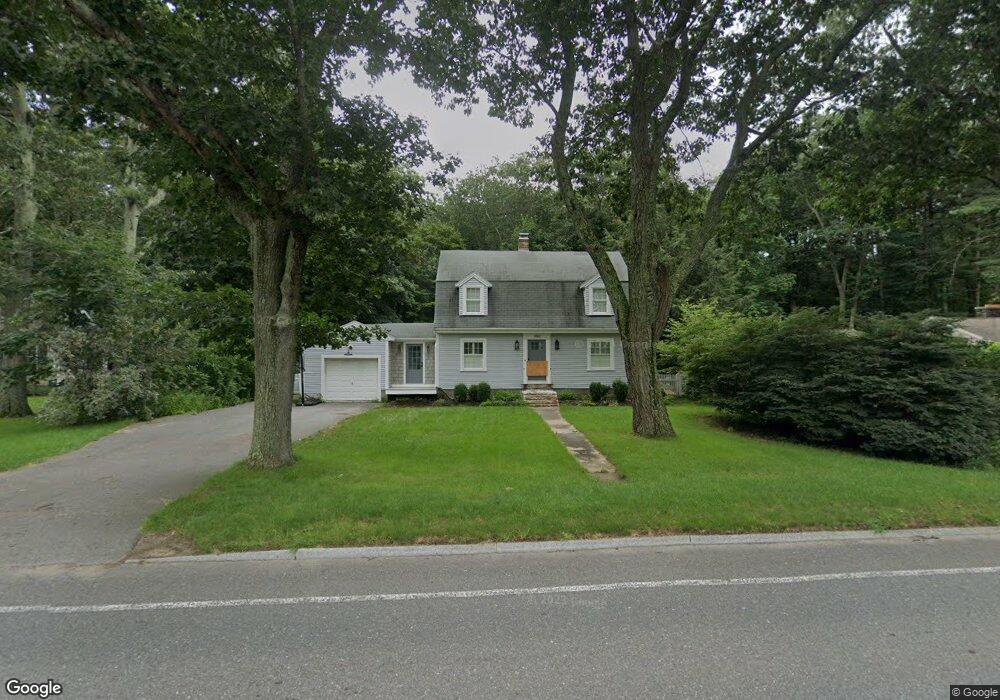
1965 Main St Concord, MA 01742
Estimated Value: $839,000 - $892,804
3
Beds
2
Baths
1,664
Sq Ft
$519/Sq Ft
Est. Value
About This Home
This home is located at 1965 Main St, Concord, MA 01742 and is currently estimated at $863,951, approximately $519 per square foot. 1965 Main St is a home located in Middlesex County with nearby schools including Thoreau Elementary School, Concord Middle School, and Maynard Knowledge Beginnings.
Ownership History
Date
Name
Owned For
Owner Type
Purchase Details
Closed on
Jun 1, 2009
Sold by
Morse Eleanor A Est
Bought by
Wynn Stephen and Wynn Catherine
Current Estimated Value
Home Financials for this Owner
Home Financials are based on the most recent Mortgage that was taken out on this home.
Original Mortgage
$389,549
Outstanding Balance
$247,447
Interest Rate
4.87%
Mortgage Type
Purchase Money Mortgage
Estimated Equity
$616,504
Create a Home Valuation Report for This Property
The Home Valuation Report is an in-depth analysis detailing your home's value as well as a comparison with similar homes in the area
Home Values in the Area
Average Home Value in this Area
Purchase History
| Date | Buyer | Sale Price | Title Company |
|---|---|---|---|
| Wynn Stephen | $403,000 | -- |
Source: Public Records
Mortgage History
| Date | Status | Borrower | Loan Amount |
|---|---|---|---|
| Open | Wynn Stephen | $389,549 |
Source: Public Records
Tax History Compared to Growth
Tax History
| Year | Tax Paid | Tax Assessment Tax Assessment Total Assessment is a certain percentage of the fair market value that is determined by local assessors to be the total taxable value of land and additions on the property. | Land | Improvement |
|---|---|---|---|---|
| 2025 | $100 | $756,500 | $378,100 | $378,400 |
| 2024 | $9,933 | $756,500 | $378,100 | $378,400 |
| 2023 | $8,647 | $667,200 | $315,100 | $352,100 |
| 2022 | $8,505 | $576,200 | $279,600 | $296,600 |
| 2021 | $8,196 | $556,800 | $279,600 | $277,200 |
| 2020 | $7,854 | $551,900 | $279,600 | $272,300 |
| 2019 | $7,797 | $549,500 | $298,100 | $251,400 |
| 2018 | $7,781 | $544,500 | $296,600 | $247,900 |
| 2017 | $7,188 | $510,900 | $266,300 | $244,600 |
| 2016 | $6,931 | $497,900 | $266,300 | $231,600 |
| 2015 | $6,753 | $472,600 | $246,600 | $226,000 |
Source: Public Records
Map
Nearby Homes
- 80 N Branch Rd
- 1844 Main St Unit 1844
- 1828 Main St
- 27 Water St
- 37 Water St
- 1687 Main St
- 70 Hillside Ave
- 65 Summit St
- 9 Black Birch Ln Unit 9
- 29 Black Birch Ln Unit 29
- 96 Forest Ridge Rd Unit 96
- 70 McCallar Ln
- 102 Highland St
- 369 Border Rd
- 88 Wright Rd
- 10 Wright Rd
- 132 Parker St Unit G5
- 54 Maple St
- 111 Central St
- 128 Parker St Unit 3B