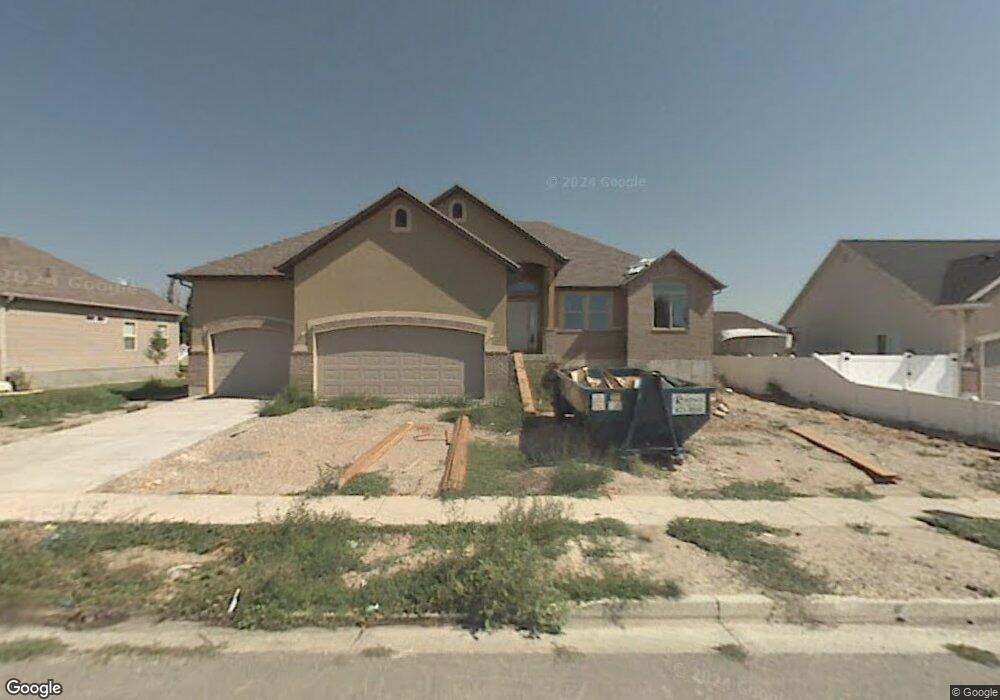
1965 S 1730 W Unit 31 Syracuse, UT 84075
Estimated Value: $584,000 - $671,299
3
Beds
3
Baths
1,820
Sq Ft
$352/Sq Ft
Est. Value
About This Home
This home is located at 1965 S 1730 W Unit 31, Syracuse, UT 84075 and is currently estimated at $639,825, approximately $351 per square foot. 1965 S 1730 W Unit 31 is a home located in Davis County with nearby schools including Cook School, Syracuse Junior High School, and Syracuse High School.
Ownership History
Date
Name
Owned For
Owner Type
Purchase Details
Closed on
Dec 13, 2021
Sold by
Kane John and Buan Kane Maria
Bought by
Kane John
Current Estimated Value
Home Financials for this Owner
Home Financials are based on the most recent Mortgage that was taken out on this home.
Original Mortgage
$435,000
Outstanding Balance
$399,153
Interest Rate
3.09%
Mortgage Type
New Conventional
Estimated Equity
$240,672
Purchase Details
Closed on
Oct 10, 2016
Sold by
Nielson Brent J
Bought by
Kane John and Buan Kane Maria L
Purchase Details
Closed on
Jun 13, 2006
Sold by
Nilson & Co Inc
Bought by
Nielson Brent J
Home Financials for this Owner
Home Financials are based on the most recent Mortgage that was taken out on this home.
Original Mortgage
$250,000
Interest Rate
6.55%
Mortgage Type
Purchase Money Mortgage
Create a Home Valuation Report for This Property
The Home Valuation Report is an in-depth analysis detailing your home's value as well as a comparison with similar homes in the area
Home Values in the Area
Average Home Value in this Area
Purchase History
| Date | Buyer | Sale Price | Title Company |
|---|---|---|---|
| Kane John | -- | Amrock Inc | |
| Kane John | -- | Inwest Title | |
| Nielson Brent J | -- | Bonneville Superior Title Co |
Source: Public Records
Mortgage History
| Date | Status | Borrower | Loan Amount |
|---|---|---|---|
| Open | Kane John | $435,000 | |
| Previous Owner | Nielson Brent J | $250,000 |
Source: Public Records
Tax History Compared to Growth
Tax History
| Year | Tax Paid | Tax Assessment Tax Assessment Total Assessment is a certain percentage of the fair market value that is determined by local assessors to be the total taxable value of land and additions on the property. | Land | Improvement |
|---|---|---|---|---|
| 2025 | -- | $360,800 | $123,707 | $237,093 |
| 2024 | -- | $342,100 | $101,129 | $240,971 |
| 2023 | $1,139 | $588,000 | $140,978 | $447,022 |
| 2022 | $1,139 | $337,700 | $81,315 | $256,385 |
| 2021 | $493 | $475,000 | $120,031 | $354,969 |
| 2020 | $214 | $413,000 | $105,154 | $307,846 |
| 2019 | $202 | $389,000 | $102,057 | $286,943 |
| 2018 | $10 | $362,000 | $98,955 | $263,045 |
| 2016 | $2,338 | $174,680 | $38,008 | $136,672 |
| 2015 | $2,384 | $165,550 | $38,008 | $127,542 |
| 2014 | $2,001 | $145,133 | $38,008 | $107,125 |
| 2013 | -- | $144,900 | $32,571 | $112,329 |
Source: Public Records
Map
Nearby Homes