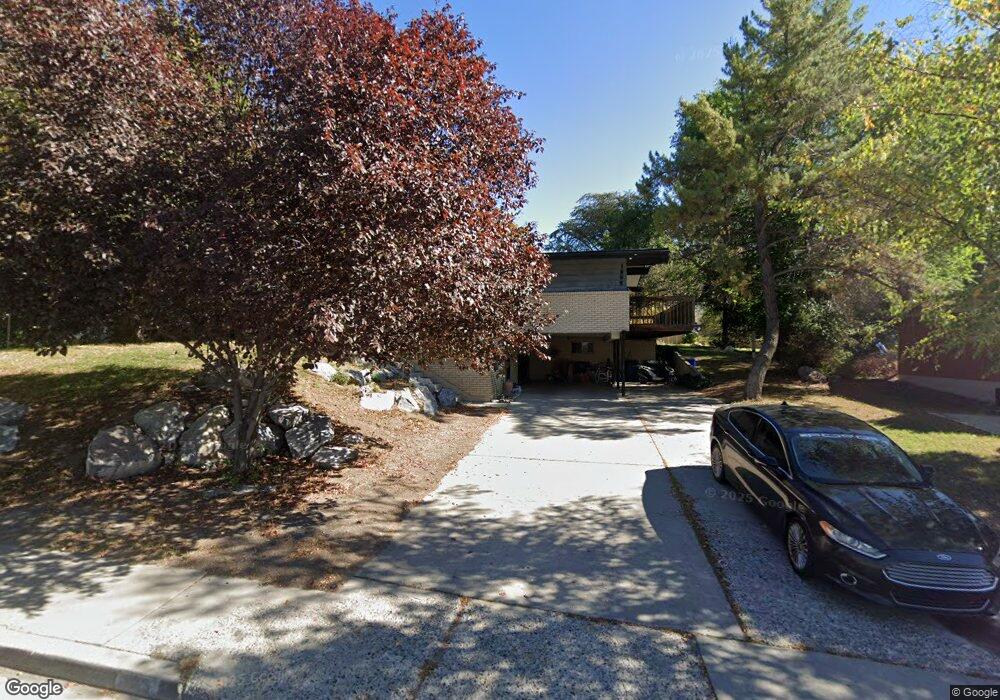
1965 S Main St Orem, UT 84058
Cherry Hill NeighborhoodEstimated Value: $517,143 - $585,000
4
Beds
2
Baths
1,428
Sq Ft
$387/Sq Ft
Est. Value
About This Home
This home is located at 1965 S Main St, Orem, UT 84058 and is currently estimated at $552,786, approximately $387 per square foot. 1965 S Main St is a home located in Utah County with nearby schools including Cherry Hill Elementary School, Lakeridge Jr High School, and Mountain View High School.
Ownership History
Date
Name
Owned For
Owner Type
Purchase Details
Closed on
Dec 11, 2023
Sold by
Barney Ralph D
Bought by
Barney Coleman and Mason Angelina M
Current Estimated Value
Home Financials for this Owner
Home Financials are based on the most recent Mortgage that was taken out on this home.
Original Mortgage
$307,000
Outstanding Balance
$301,904
Interest Rate
7.5%
Mortgage Type
New Conventional
Estimated Equity
$250,882
Purchase Details
Closed on
May 26, 2020
Sold by
Wentz Stuart R and Estate Of Evelyn Wentz Rowley
Bought by
Barney Ralph D and Barney Linnea S
Purchase Details
Closed on
Dec 11, 2013
Sold by
Wentz Craig V and Wentz Rodger Trent
Bought by
Barney Ralph D and Barney Linnea S
Create a Home Valuation Report for This Property
The Home Valuation Report is an in-depth analysis detailing your home's value as well as a comparison with similar homes in the area
Home Values in the Area
Average Home Value in this Area
Purchase History
We collect this data history from publicly available records. To have your information removed, we recommend requesting removal directly through your county’s website.
| Date | Buyer | Sale Price | Title Company |
|---|---|---|---|
| Barney Coleman | -- | Pro Title & Escrow | |
| Barney Ralph D | -- | None Available | |
| Barney Ralph D | -- | None Available |
Source: Public Records
Mortgage History
We collect this data history from publicly available records. To have your information removed, we recommend requesting removal directly through your county’s website.
| Date | Status | Borrower | Loan Amount |
|---|---|---|---|
| Open | Barney Coleman | $307,000 |
Source: Public Records
Tax History
| Year | Tax Paid | Tax Assessment Tax Assessment Total Assessment is a certain percentage of the fair market value that is determined by local assessors to be the total taxable value of land and additions on the property. | Land | Improvement |
|---|---|---|---|---|
| 2025 | $2,115 | $258,665 | -- | -- |
| 2024 | $2,115 | $258,610 | $0 | $0 |
| 2023 | $1,970 | $258,940 | $0 | $0 |
| 2022 | $1,970 | $250,800 | $0 | $0 |
| 2021 | $1,749 | $337,300 | $147,900 | $189,400 |
| 2020 | $1,594 | $302,200 | $118,300 | $183,900 |
| 2019 | $1,453 | $286,400 | $102,500 | $183,900 |
| 2018 | $1,392 | $262,100 | $98,600 | $163,500 |
| 2017 | $1,270 | $128,095 | $0 | $0 |
| 2016 | $1,311 | $121,935 | $0 | $0 |
| 2015 | $1,281 | $112,695 | $0 | $0 |
| 2014 | $1,169 | $102,410 | $0 | $0 |
Source: Public Records
Map
Nearby Homes
Your Personal Tour Guide
Ask me questions while you tour the home.