19658 SW 88th Loop Dunnellon, FL 34432
Estimated Value: $355,382 - $527,000
3
Beds
2
Baths
2,123
Sq Ft
$208/Sq Ft
Est. Value
About This Home
This home is located at 19658 SW 88th Loop, Dunnellon, FL 34432 and is currently estimated at $442,596, approximately $208 per square foot. 19658 SW 88th Loop is a home located in Marion County with nearby schools including Ponderosa Elementary School, Dunnellon Elementary School, and Dunnellon Middle School.
Ownership History
Date
Name
Owned For
Owner Type
Purchase Details
Closed on
May 31, 2016
Sold by
Anderson Jon J
Bought by
Hague Elizabeth K and Hague William J
Current Estimated Value
Purchase Details
Closed on
Mar 1, 2013
Sold by
Mcbryde Wendy J
Bought by
Anderson Jon J
Purchase Details
Closed on
Dec 11, 2012
Sold by
Anderson Jon J
Bought by
Mcbryde Wendy J
Purchase Details
Closed on
May 16, 2012
Sold by
Anderson Jon J and Laflin Mary C
Bought by
Anderson Jon J
Purchase Details
Closed on
Jan 8, 2008
Sold by
Anderson Jon J and Laflin Mary C
Bought by
Anderson Jon J and Laflin Mary C
Purchase Details
Closed on
Aug 17, 2006
Sold by
Carr Leo Martin and Carr Mary Ruth
Bought by
Anderson Jon J and Laflin Mary C
Purchase Details
Closed on
May 28, 2004
Sold by
Crandall Donald E and Crandall Jo Ann
Bought by
Carr Leo Martin and Carr Mary Ruth
Create a Home Valuation Report for This Property
The Home Valuation Report is an in-depth analysis detailing your home's value as well as a comparison with similar homes in the area
Home Values in the Area
Average Home Value in this Area
Purchase History
| Date | Buyer | Sale Price | Title Company |
|---|---|---|---|
| Hague Elizabeth K | $215,000 | Sunbelt Title Services, Inc | |
| Anderson Jon J | -- | None Available | |
| Mcbryde Wendy J | -- | None Available | |
| Anderson Jon J | $100,000 | Attorney | |
| Anderson Jon J | -- | Attorney | |
| Anderson Jon J | $340,000 | Stewart Title Pinellas Inc | |
| Carr Leo Martin | $239,000 | First American Title Ins Co |
Source: Public Records
Tax History Compared to Growth
Tax History
| Year | Tax Paid | Tax Assessment Tax Assessment Total Assessment is a certain percentage of the fair market value that is determined by local assessors to be the total taxable value of land and additions on the property. | Land | Improvement |
|---|---|---|---|---|
| 2024 | $4,268 | $293,594 | -- | -- |
| 2023 | $4,549 | $309,186 | $0 | $0 |
| 2022 | $4,430 | $300,181 | $20,637 | $279,544 |
| 2021 | $3,649 | $212,290 | $12,438 | $199,852 |
| 2020 | $3,340 | $188,782 | $11,977 | $176,805 |
| 2019 | $3,037 | $163,617 | $11,977 | $151,640 |
| 2018 | $2,761 | $153,239 | $8,292 | $144,947 |
| 2017 | $2,821 | $148,879 | $7,370 | $141,509 |
| 2016 | $2,112 | $142,699 | $0 | $0 |
| 2015 | $2,414 | $159,216 | $0 | $0 |
| 2014 | $2,279 | $157,952 | $0 | $0 |
Source: Public Records
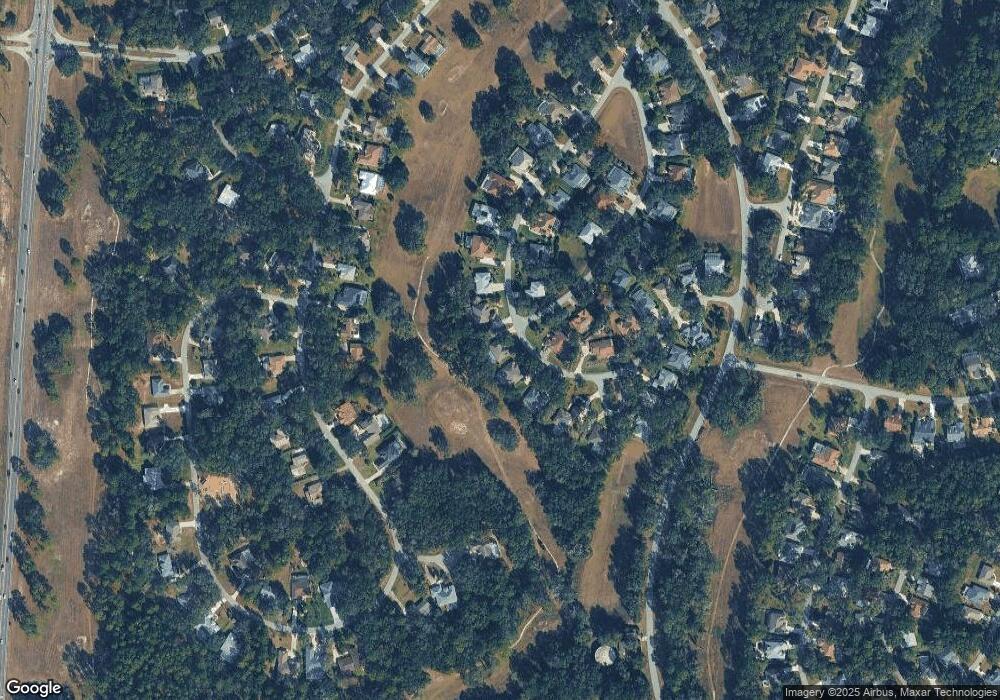
Map
Nearby Homes
- 9027 SW 196th Ct
- 19642 SW 88th Loop
- 8943 SW 196th Ct
- 9009 SW 194th Ct
- 8835 SW 196th Terrace Rd
- 8859 SW 196th Avenue Rd
- 8796 SW 196th Terrace Rd
- 8770 SW 196th Terrace Rd
- 8869 SW 194th Ct
- 9221 SW 193rd Cir
- 19330 SW 91st Loop
- 19799 SW 88th Place Rd
- 9120 SW 193rd Cir
- 19845 SW 88th Place Rd
- 00 SW 193rd Cir
- 19699 SW 88th Place Rd
- 19649 SW 93rd Ln
- 19862 SW 93rd Lane Rd
- TBD SW 95th Place
- TBD SW 93rd Ln
- 19662 SW 88th Loop
- 19654 SW 88th Loop
- 19659 SW 88th Loop
- 19666 SW 88th Loop
- 19651 SW 88th Loop
- 9041 SW 196th Ct
- 19670 SW 88th Loop
- 19646 SW 88th Loop
- 19643 SW 88 Loop
- 19643 SW 88th Loop
- 19675 SW 88th Loop
- 19674 SW 88th Loop
- 19687 SW 88th Loop
- 9013 SW 196th Ct
- 8998 SW 196th Ct
- 9147 SW 197th Cir
- 9175 SW 197th Cir
- 19691 SW 88th Loop
- 9129 SW 197th Cir
- 9075 SW 197th Cir