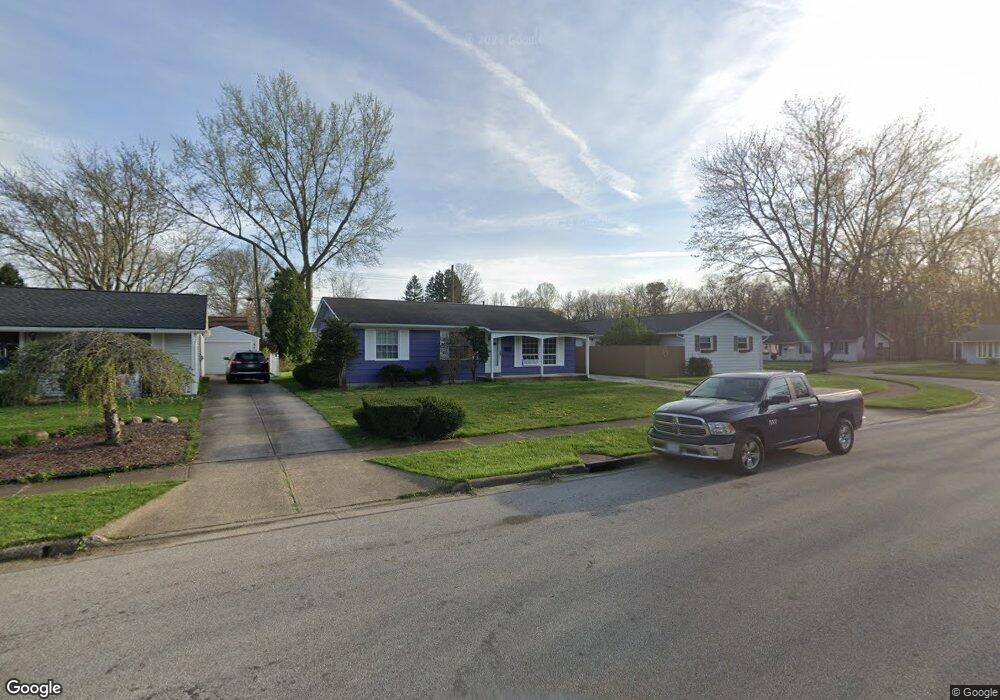
1966 Kelsey Dr Cuyahoga Falls, OH 44221
Northmoreland NeighborhoodEstimated Value: $157,000 - $189,574
3
Beds
2
Baths
1,050
Sq Ft
$168/Sq Ft
Est. Value
About This Home
This home is located at 1966 Kelsey Dr, Cuyahoga Falls, OH 44221 and is currently estimated at $176,394, approximately $167 per square foot. 1966 Kelsey Dr is a home located in Summit County with nearby schools including Elizabeth Price Elementary School, Bolich Middle School, and Cuyahoga Falls High School.
Ownership History
Date
Name
Owned For
Owner Type
Purchase Details
Closed on
Dec 9, 2016
Sold by
Nancy E Male
Bought by
Fuchs Stephen and Fuchs Beth
Current Estimated Value
Home Financials for this Owner
Home Financials are based on the most recent Mortgage that was taken out on this home.
Original Mortgage
$70,000
Outstanding Balance
$57,562
Interest Rate
4.13%
Estimated Equity
$118,832
Purchase Details
Closed on
Mar 24, 1999
Sold by
Male Edwin K and Male Nancy E
Bought by
Male Edwin K and Male Nancy E
Create a Home Valuation Report for This Property
The Home Valuation Report is an in-depth analysis detailing your home's value as well as a comparison with similar homes in the area
Home Values in the Area
Average Home Value in this Area
Purchase History
| Date | Buyer | Sale Price | Title Company |
|---|---|---|---|
| Fuchs Stephen | -- | -- | |
| Male Edwin K | -- | -- |
Source: Public Records
Mortgage History
| Date | Status | Borrower | Loan Amount |
|---|---|---|---|
| Open | Fuchs Stephen | $70,000 | |
| Closed | Fuchs Stephen | -- |
Source: Public Records
Tax History Compared to Growth
Tax History
| Year | Tax Paid | Tax Assessment Tax Assessment Total Assessment is a certain percentage of the fair market value that is determined by local assessors to be the total taxable value of land and additions on the property. | Land | Improvement |
|---|---|---|---|---|
| 2025 | $2,697 | $49,956 | $11,897 | $38,059 |
| 2024 | $2,697 | $49,956 | $11,897 | $38,059 |
| 2023 | $2,697 | $49,956 | $11,897 | $38,059 |
| 2022 | $2,478 | $37,283 | $8,880 | $28,403 |
| 2021 | $2,478 | $37,283 | $8,880 | $28,403 |
| 2020 | $2,437 | $37,280 | $8,880 | $28,400 |
| 2019 | $2,392 | $33,320 | $8,440 | $24,880 |
| 2018 | $2,031 | $33,320 | $8,440 | $24,880 |
| 2017 | $1,897 | $33,320 | $8,440 | $24,880 |
| 2016 | $1,899 | $30,670 | $8,440 | $22,230 |
| 2015 | $1,897 | $30,670 | $8,440 | $22,230 |
| 2014 | $1,898 | $30,670 | $8,440 | $22,230 |
| 2013 | $1,323 | $30,930 | $8,440 | $22,490 |
Source: Public Records
Map
Nearby Homes
- 1521 Anderson Rd
- 2183 Plymouth Ln
- 1860 Sequoia St
- 1860 Issaquah St
- 1921 Dwight St
- 2300 Larchdale Dr
- 298 Game Dr
- 2375 Plymouth Ln
- 2100 Delmore St
- 1219 Curtis Ave
- 1473 Munroe Falls Ave Unit 5
- 1120 Saxe Ave
- 70 Richard Dr
- 1140 Cooper Dr
- 1109 Cooper Dr
- 907 Broadway St E
- 135 Guise Park Dr
- 2289 Bailey Rd
- 2357 Liberty St
- 1633 Bancroft St