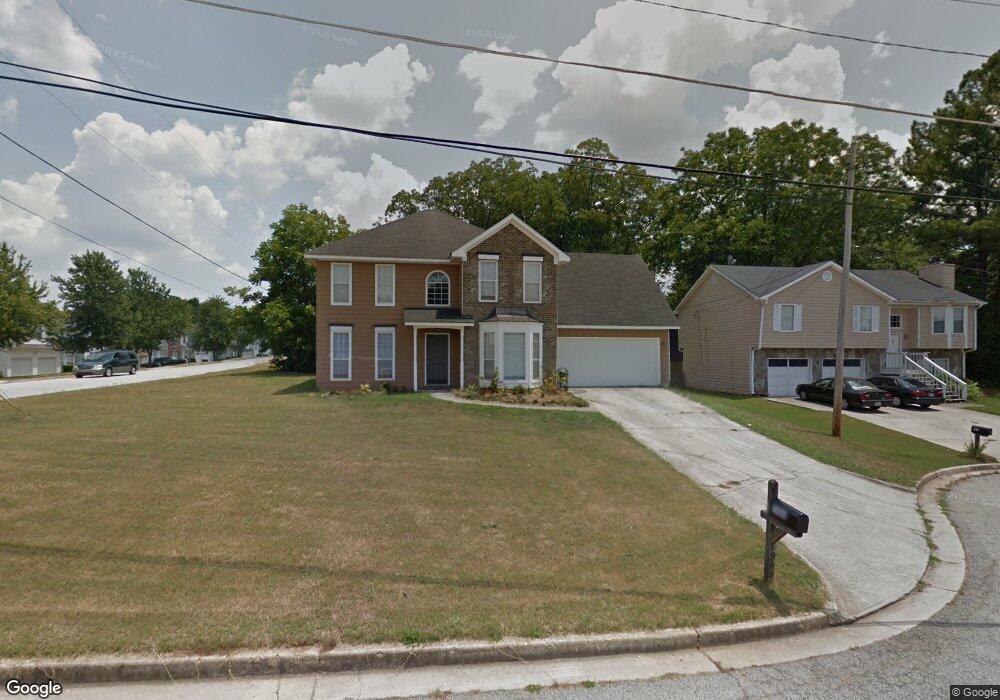
1966 Lown Farm Ct Lithonia, GA 30058
Estimated Value: $254,000 - $296,000
4
Beds
3
Baths
2,078
Sq Ft
$128/Sq Ft
Est. Value
About This Home
This home is located at 1966 Lown Farm Ct, Lithonia, GA 30058 and is currently estimated at $266,573, approximately $128 per square foot. 1966 Lown Farm Ct is a home located in DeKalb County with nearby schools including Redan Elementary School, Lithonia Middle School, and Lithonia High School.
Ownership History
Date
Name
Owned For
Owner Type
Purchase Details
Closed on
Jan 20, 2022
Sold by
Polifond Claire
Bought by
Castor Pierre Jules
Current Estimated Value
Home Financials for this Owner
Home Financials are based on the most recent Mortgage that was taken out on this home.
Original Mortgage
$214,308
Outstanding Balance
$198,374
Interest Rate
3.45%
Mortgage Type
FHA
Estimated Equity
$68,199
Purchase Details
Closed on
Aug 29, 2011
Sold by
Oak Capital Reo Llc
Bought by
Polifond Claire
Purchase Details
Closed on
Mar 1, 2011
Sold by
Ivy Nashanna and Ivy James
Bought by
Oak Capital Reo Llc
Purchase Details
Closed on
Dec 19, 2002
Sold by
Whitfield Florence
Bought by
Ivy Nashanna and Ivy James
Home Financials for this Owner
Home Financials are based on the most recent Mortgage that was taken out on this home.
Original Mortgage
$121,600
Interest Rate
5.95%
Mortgage Type
New Conventional
Purchase Details
Closed on
May 7, 1996
Sold by
Source One Mtgservs
Bought by
Secretary Of Hud
Create a Home Valuation Report for This Property
The Home Valuation Report is an in-depth analysis detailing your home's value as well as a comparison with similar homes in the area
Home Values in the Area
Average Home Value in this Area
Purchase History
| Date | Buyer | Sale Price | Title Company |
|---|---|---|---|
| Castor Pierre Jules | $230,000 | -- | |
| Polifond Claire | $42,000 | -- | |
| Oak Capital Reo Llc | $57,000 | -- | |
| Ivy Nashanna | $152,000 | -- | |
| Secretary Of Hud | -- | -- | |
| Source One Mtgservs | $104,730 | -- |
Source: Public Records
Mortgage History
| Date | Status | Borrower | Loan Amount |
|---|---|---|---|
| Open | Castor Pierre Jules | $214,308 | |
| Previous Owner | Ivy Nashanna | $121,600 |
Source: Public Records
Tax History Compared to Growth
Tax History
| Year | Tax Paid | Tax Assessment Tax Assessment Total Assessment is a certain percentage of the fair market value that is determined by local assessors to be the total taxable value of land and additions on the property. | Land | Improvement |
|---|---|---|---|---|
| 2025 | $3,202 | $102,280 | $15,000 | $87,280 |
| 2024 | $3,275 | $100,200 | $15,000 | $85,200 |
| 2023 | $3,275 | $88,000 | $15,000 | $73,000 |
| 2022 | $4,050 | $84,280 | $15,000 | $69,280 |
| 2021 | $3,127 | $63,240 | $8,000 | $55,240 |
| 2020 | $2,711 | $53,760 | $8,000 | $45,760 |
| 2019 | $2,712 | $53,800 | $8,000 | $45,800 |
| 2018 | $2,302 | $53,920 | $8,000 | $45,920 |
| 2017 | $2,288 | $41,520 | $3,720 | $37,800 |
| 2016 | $2,043 | $38,280 | $3,720 | $34,560 |
| 2014 | $1,616 | $27,920 | $3,720 | $24,200 |
Source: Public Records
Map
Nearby Homes
- 6240 Giles Rd
- 2123 Lown Farm Ln
- 2039 Raintree Place
- 2045 Lown Farm Trail Unit 3
- 2067 Raintree Place
- 6238 Phillips Lake Ct
- 6082 Raintree Bend
- 6126 Marbut Rd Unit II
- 1882 Corners Cir
- 6182 Saint Charles Ct
- 2030 Hilda Burns Place
- 6047 Marbut Rd
- 6653 Eastbriar Dr
- 6351 Stablewood Way
- 2128 Tiffany Ln
- 6202 Saint Christophers Ct
- 2063 Wellborn Close
- 6260 Marbut Farms Terrace
- 6124 Waterton Dr Unit 1
- 2191 Phillips Rd
- 1972 Lown Farm Ct Unit 3
- 6189 Giles Rd
- 1976 Lown Farm Ct
- 6176 Giles Rd
- 6182 Giles Rd
- 1965 Lown Farm Ct
- 6188 Giles Rd
- 6153 Giles Rd
- 1971 Lown Farm Ct
- 1975 Lown Farm Ct
- 6194 Giles Rd
- 6164 Giles Rd
- 6150 Kenton Oaks Ct
- 6163 Remington Park
- 6130 Kenton Oaks Ct
- 6156 Kenton Oaks Ct
- 6157 Remington Park
- 6169 Remington Park
- 6142 Kenton Oaks Ct
- 6134 Kenton Oaks Ct