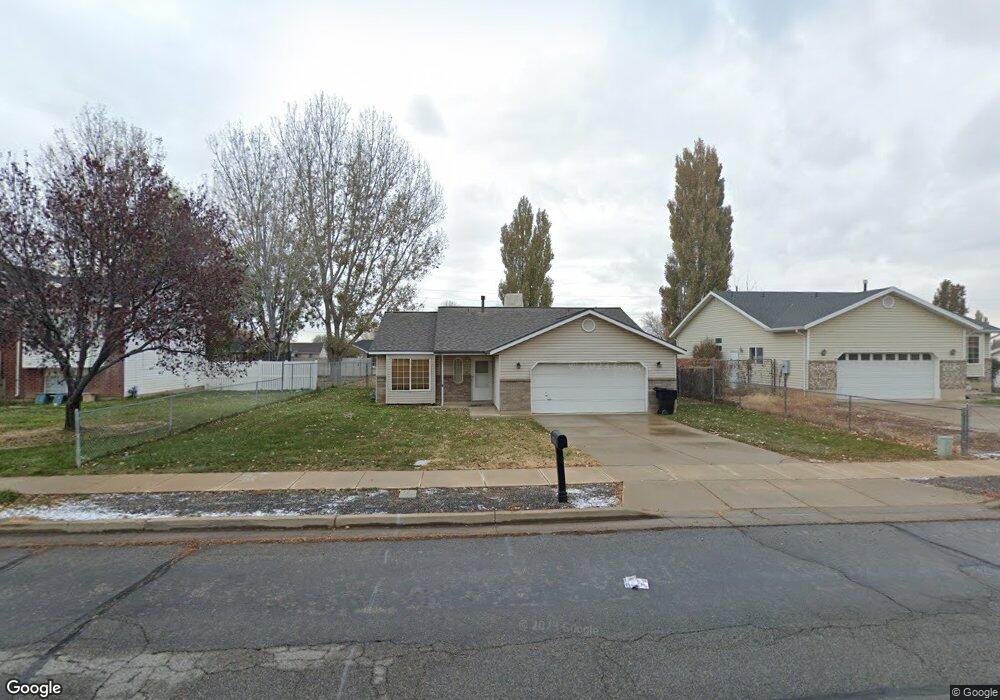
1967 N 950 W Clearfield, UT 84015
Estimated Value: $385,000 - $421,000
3
Beds
2
Baths
1,104
Sq Ft
$368/Sq Ft
Est. Value
About This Home
This home is located at 1967 N 950 W, Clearfield, UT 84015 and is currently estimated at $405,946, approximately $367 per square foot. 1967 N 950 W is a home located in Davis County with nearby schools including Fremont School, Sunset Junior High School, and Northridge High School.
Ownership History
Date
Name
Owned For
Owner Type
Purchase Details
Closed on
Jan 7, 2003
Sold by
Hud
Bought by
Turner Kimberli
Current Estimated Value
Purchase Details
Closed on
Aug 29, 2002
Sold by
Firstar Bank Na
Bought by
Hud
Purchase Details
Closed on
Feb 12, 2002
Sold by
Wolfe John R and Wolfe Elizabeth
Bought by
Firstar Bank Na
Purchase Details
Closed on
Jun 7, 1996
Sold by
Mark Higley Construction Lc
Bought by
Wolfe John R and Wolfe Elizabeth
Home Financials for this Owner
Home Financials are based on the most recent Mortgage that was taken out on this home.
Original Mortgage
$92,485
Interest Rate
7.96%
Mortgage Type
FHA
Purchase Details
Closed on
Jan 25, 1996
Sold by
Higley & Higley Inc Construction
Bought by
Mark Higley Construction Lc
Home Financials for this Owner
Home Financials are based on the most recent Mortgage that was taken out on this home.
Original Mortgage
$54,500
Interest Rate
7.18%
Mortgage Type
Construction
Create a Home Valuation Report for This Property
The Home Valuation Report is an in-depth analysis detailing your home's value as well as a comparison with similar homes in the area
Home Values in the Area
Average Home Value in this Area
Purchase History
| Date | Buyer | Sale Price | Title Company |
|---|---|---|---|
| Turner Kimberli | -- | Us Title | |
| Hud | -- | Backman Stewart Title Servic | |
| Firstar Bank Na | $102,435 | Backman Stewart Title Servic | |
| Wolfe John R | -- | Associated Title Company | |
| Mark Higley Construction Lc | -- | Bonneville Title Company Inc |
Source: Public Records
Mortgage History
| Date | Status | Borrower | Loan Amount |
|---|---|---|---|
| Previous Owner | Wolfe John R | $92,485 | |
| Previous Owner | Mark Higley Construction Lc | $54,500 |
Source: Public Records
Tax History Compared to Growth
Tax History
| Year | Tax Paid | Tax Assessment Tax Assessment Total Assessment is a certain percentage of the fair market value that is determined by local assessors to be the total taxable value of land and additions on the property. | Land | Improvement |
|---|---|---|---|---|
| 2025 | $2,059 | $198,000 | $88,773 | $109,227 |
| 2024 | $1,986 | $191,950 | $97,742 | $94,208 |
| 2023 | $1,828 | $327,000 | $110,923 | $216,077 |
| 2022 | $1,935 | $191,400 | $68,201 | $123,199 |
| 2021 | $1,758 | $258,000 | $84,789 | $173,211 |
| 2020 | $1,528 | $222,000 | $71,735 | $150,265 |
| 2019 | $1,480 | $210,000 | $84,406 | $125,594 |
| 2018 | $1,370 | $191,000 | $71,368 | $119,632 |
| 2016 | $1,238 | $89,100 | $27,726 | $61,374 |
| 2015 | $1,202 | $82,280 | $27,726 | $54,554 |
| 2014 | $1,183 | $82,258 | $27,726 | $54,532 |
| 2013 | -- | $77,541 | $23,071 | $54,470 |
Source: Public Records
Map
Nearby Homes