Estimated Value: $2,082,074
Studio
--
Bath
--
Sq Ft
43,560
Sq Ft
About This Home
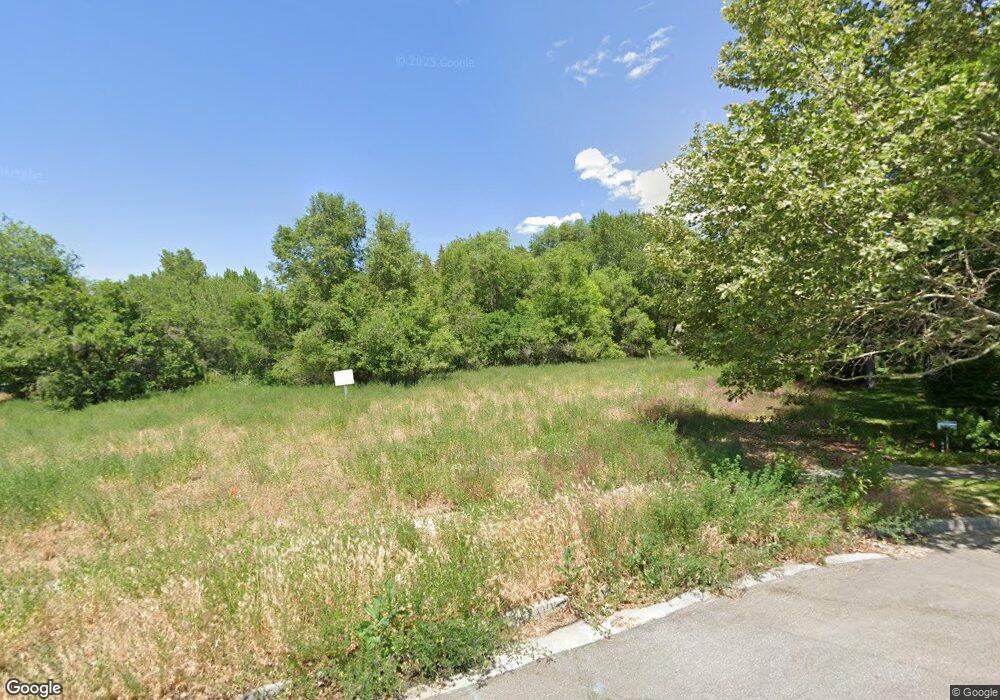
This home is located at 1967 Redbirch Cove Unit 4, Sandy, UT 84093 and is currently estimated at $2,082,074. 1967 Redbirch Cove Unit 4 is a home located in Salt Lake County with nearby schools including Oakdale School, Albion Middle School, and Brighton High School.
Ownership History
Date
Name
Owned For
Owner Type
Purchase Details
Closed on
May 7, 2008
Sold by
The Ort Nell Lp
Bought by
Alder John B and Alder Elinor N
Current Estimated Value
Home Financials for this Owner
Home Financials are based on the most recent Mortgage that was taken out on this home.
Original Mortgage
$450,000
Interest Rate
5.88%
Mortgage Type
Purchase Money Mortgage
Purchase Details
Closed on
May 2, 2008
Sold by
Jensen Paul M
Bought by
The Ort Nell Lp
Home Financials for this Owner
Home Financials are based on the most recent Mortgage that was taken out on this home.
Original Mortgage
$450,000
Interest Rate
5.88%
Mortgage Type
Purchase Money Mortgage
Purchase Details
Closed on
Apr 29, 2008
Sold by
Jensen Paul M
Bought by
Jensen Paul M and Paul M Jensen Trust
Home Financials for this Owner
Home Financials are based on the most recent Mortgage that was taken out on this home.
Original Mortgage
$450,000
Interest Rate
5.88%
Mortgage Type
Purchase Money Mortgage
Purchase Details
Closed on
May 12, 1999
Sold by
Platt Holdings Lc
Bought by
Jensen Paul M and Danelle A Jensen Trust
Create a Home Valuation Report for This Property
The Home Valuation Report is an in-depth analysis detailing your home's value as well as a comparison with similar homes in the area
Home Values in the Area
Average Home Value in this Area
Purchase History
| Date | Buyer | Sale Price | Title Company |
|---|---|---|---|
| Alder John B | -- | Highland Title Agency | |
| The Ort Nell Lp | -- | Highland Title Agency | |
| Jensen Paul M | -- | Highland Title Agency | |
| Jensen Paul M | -- | Surety Title |
Source: Public Records
Mortgage History
| Date | Status | Borrower | Loan Amount |
|---|---|---|---|
| Closed | Alder John B | $450,000 | |
| Closed | The Ort Nell Lp | $450,000 |
Source: Public Records
Tax History
| Year | Tax Paid | Tax Assessment Tax Assessment Total Assessment is a certain percentage of the fair market value that is determined by local assessors to be the total taxable value of land and additions on the property. | Land | Improvement |
|---|---|---|---|---|
| 2025 | $8,111 | $943,300 | $943,300 | -- |
| 2024 | $8,111 | $852,800 | $852,800 | -- |
| 2023 | $7,922 | $812,300 | $812,300 | $0 |
| 2022 | $0 | $796,400 | $796,400 | $0 |
| 2021 | $8,506 | $724,000 | $724,000 | $0 |
| 2020 | $8,390 | $673,700 | $673,700 | $0 |
| 2019 | $8,343 | $652,500 | $652,500 | $0 |
| 2016 | $7,814 | $592,600 | $592,600 | $0 |
Source: Public Records
Map
Nearby Homes
- 2161 E Lorita Way
- 8081 Beaumont Dr
- 2238 Cottonwood Cove Ln
- 1997 E Parkridge Dr
- 2152 E Creek Rd
- 2110 Lonsdale Dr
- 8122 S Willow Creek Cove
- 8266 S Creek Hollow Cove
- 7462 S 2300 E
- 7265 S 1950 E Unit 14
- 8483 Terrace Dr
- 1627 E Mulberry Way
- 1990 E Terra Vista Way
- 7195 S Villandrie Ln
- 1695 E Ensign Place
- 1924 E Viscounti Cove
- 2569 E Canterbury Ln
- 2600 E Oak Creek Dr
- 1938 E 7130 S
- 1920 E 7130 S
- 1947 E Redbirch Cove
- 1947 Redbirch Cove
- 1971 Redbirch Cove
- 1968 Redbirch Cove
- 7887 S Siesta Dr
- 1980 Forest Bend Dr
- 1990 Forest Bend Dr
- 7846 Highland Dr
- 7902 Highland Dr
- 7861 Siesta Dr
- 7861 Siesta Dr Unit 2
- 7884 S Highland Dr
- 7907 S Siesta Dr
- 7905 Siesta Dr
- 1979 Hunters Meadow Cir
- 1950 Forest Bend Dr
- 7915 Siesta Dr
- 1994 E Forest Bend Dr
- 7864 Siesta Dr
- 7900 Highland Dr
Your Personal Tour Guide
Ask me questions while you tour the home.