
Seller's Agent in 2025
Gerilynn Baker
Coldwell Banker Realty
(513) 305-0948
2 in this area
70 Total Sales
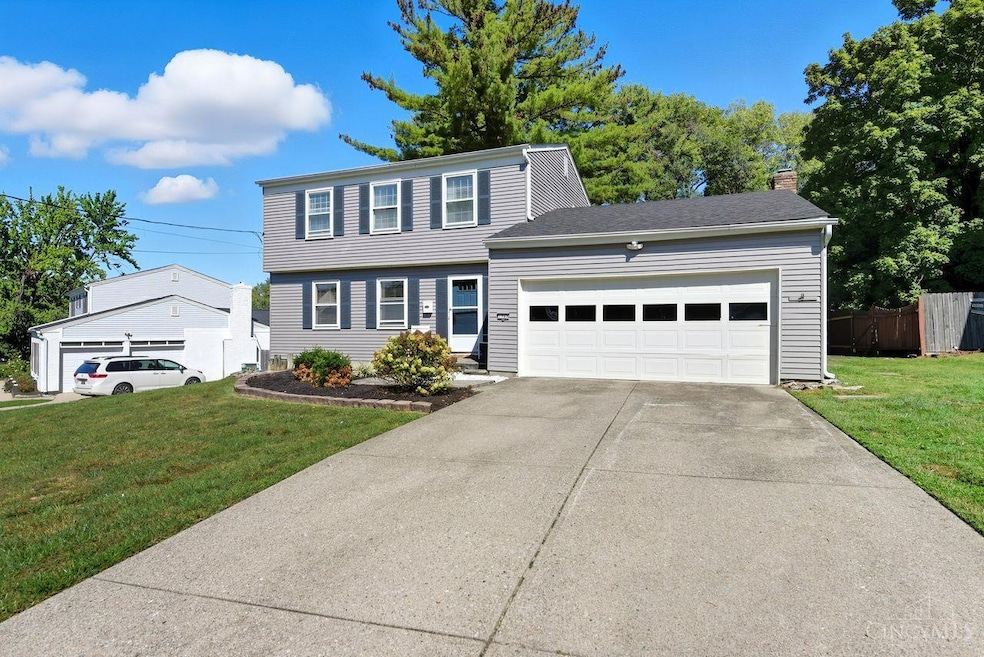


This two-story home in Pleasant Run Farms welcomes new owners with a blend of comfort and functionality. The inviting first floor features formal living and dining rooms ideal for entertaining or family gatherings, as well as a spacious family room with direct access to a large deck, perfect for outdoor relaxation or hosting guests. The open-concept kitchen boasts brand new appliances and flows seamlessly into the family area for easy, modern living. Upstairs, the primary bedroom offers an ensuite full bath and dual closets along with original hardwood floors adding warmth and timeless appeal. Step outside to enjoy a generous, flat, fully fenced backyard, an excellent space for children, pets, or any outdoor activity. All appliances, including washer and dryer, are included for a hassle-free move. Located close to highways, Mercy Hospital, and popular restaurants. With no HOA restrictions, this move-in ready property offers convenience and true flexibility.
Last Agent to Sell the Property
Coldwell Banker Realty License #0000431217 Listed on: 10/02/2025
| Date | Type | Sale Price | Title Company |
|---|---|---|---|
| Deed | $280,000 | None Listed On Document | |
| Warranty Deed | $144,000 | Mattingly Ford Ttl Svcs Llc | |
| Survivorship Deed | $129,000 | -- | |
| Warranty Deed | -- | -- |
| Date | Status | Loan Amount | Loan Type |
|---|---|---|---|
| Open | $271,600 | New Conventional | |
| Previous Owner | $124,542 | FHA | |
| Previous Owner | $122,550 | No Value Available | |
| Previous Owner | $91,350 | No Value Available |
| Date | Event | Price | List to Sale | Price per Sq Ft |
|---|---|---|---|---|
| 11/03/2025 11/03/25 | Sold | $280,000 | 0.0% | $149 / Sq Ft |
| 10/06/2025 10/06/25 | Pending | -- | -- | -- |
| 10/02/2025 10/02/25 | For Sale | $279,900 | -- | $149 / Sq Ft |
| Year | Tax Paid | Tax Assessment Tax Assessment Total Assessment is a certain percentage of the fair market value that is determined by local assessors to be the total taxable value of land and additions on the property. | Land | Improvement |
|---|---|---|---|---|
| 2025 | $3,143 | $50,400 | $15,344 | $35,056 |
| 2024 | $3,069 | $50,400 | $15,344 | $35,056 |
| 2023 | $2,915 | $50,400 | $15,344 | $35,056 |
| 2022 | $3,986 | $55,388 | $13,283 | $42,105 |
| 2021 | $3,945 | $55,388 | $13,283 | $42,105 |
| 2020 | $3,994 | $55,388 | $13,283 | $42,105 |
| 2019 | $3,376 | $44,310 | $10,626 | $33,684 |
| 2018 | $3,052 | $44,310 | $10,626 | $33,684 |
| 2017 | $2,898 | $44,310 | $10,626 | $33,684 |
| 2016 | $2,831 | $42,529 | $11,564 | $30,965 |
| 2015 | $2,862 | $42,529 | $11,564 | $30,965 |
| 2014 | $2,868 | $42,529 | $11,564 | $30,965 |
| 2013 | $2,851 | $43,397 | $11,799 | $31,598 |
Seller's Agent in 2025
Gerilynn Baker
Coldwell Banker Realty
(513) 305-0948
2 in this area
70 Total Sales
Buyer's Agent in 2025
Jeanette Violette
Howard Hanna Real Estate Serv
(937) 716-3744
1 in this area
65 Total Sales
Source: MLS of Greater Cincinnati (CincyMLS)
MLS Number: 1857163
APN: 590-0412-0318
Disclaimer: Certain information contained herein is derived from information provided by parties other than Homes.com. All information provided is deemed reliable, but is not guaranteed to be accurate and should be independently verified.
![]() The data relating to real estate for sale on this website comes in part from the Broker Reciprocity programs of the MLS of Greater Cincinnati, Inc.. Those listings held by brokerage firms other than Ten-X are marked with the Broker Reciprocity logo and house icon. The properties displayed may not be all of the properties available through Broker Reciprocity.
The data relating to real estate for sale on this website comes in part from the Broker Reciprocity programs of the MLS of Greater Cincinnati, Inc.. Those listings held by brokerage firms other than Ten-X are marked with the Broker Reciprocity logo and house icon. The properties displayed may not be all of the properties available through Broker Reciprocity.
IDX information is provided exclusively for personal, non-commercial use, and may not be used for any purpose other than to identify prospective properties consumers may be interested in purchasing.
Information is deemed reliable but not guaranteed.
Ten-X does not display the entire Cincinnati MLS Broker Reciprocity™ database on this web site. The listings of some real estate brokerage firms have been excluded.
Copyright 2026, MLS of Greater Cincinnati, Inc. All rights reserved
Ask me questions while you tour the home.