1968 Forest Elm Ct Columbus, OH 43229
Forest Park East NeighborhoodEstimated Value: $258,837 - $291,000
3
Beds
2
Baths
1,040
Sq Ft
$264/Sq Ft
Est. Value
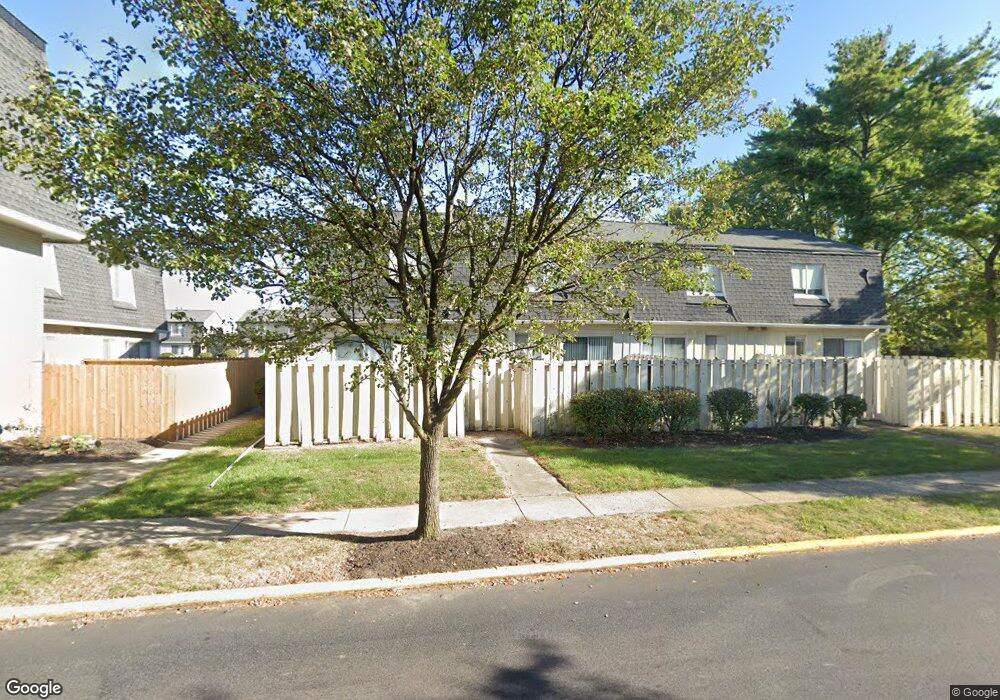
About This Home
This home is located at 1968 Forest Elm Ct, Columbus, OH 43229 and is currently estimated at $274,209, approximately $263 per square foot. 1968 Forest Elm Ct is a home located in Franklin County with nearby schools including Forest Park Elementary School, Woodward Park Middle School, and Northland High School.
Ownership History
Date
Name
Owned For
Owner Type
Purchase Details
Closed on
Jul 31, 2019
Sold by
Smith Robert C and Smith Rosalie C
Bought by
Mollette Samantha J and Krieger Cody R
Current Estimated Value
Home Financials for this Owner
Home Financials are based on the most recent Mortgage that was taken out on this home.
Original Mortgage
$125,966
Outstanding Balance
$114,505
Interest Rate
5.75%
Mortgage Type
FHA
Estimated Equity
$159,704
Purchase Details
Closed on
Dec 19, 2005
Sold by
Henry Mien and Nou Sambo
Bought by
Smith Robert C and Smith Rosalie C
Purchase Details
Closed on
Jan 8, 1999
Sold by
Krieger Regina K and Perkins Regina Kay
Bought by
Mien Henry and Nou Sambo
Home Financials for this Owner
Home Financials are based on the most recent Mortgage that was taken out on this home.
Original Mortgage
$85,583
Interest Rate
6.83%
Mortgage Type
FHA
Purchase Details
Closed on
Jul 1, 1993
Bought by
Krieger Regina K
Purchase Details
Closed on
Aug 2, 1989
Purchase Details
Closed on
May 30, 1989
Create a Home Valuation Report for This Property
The Home Valuation Report is an in-depth analysis detailing your home's value as well as a comparison with similar homes in the area
Home Values in the Area
Average Home Value in this Area
Purchase History
| Date | Buyer | Sale Price | Title Company |
|---|---|---|---|
| Mollette Samantha J | $146,000 | None Available | |
| Smith Robert C | $105,000 | Chicago Tit | |
| Mien Henry | $93,000 | Independent Title | |
| Krieger Regina K | -- | -- | |
| -- | $72,900 | -- | |
| -- | $71,300 | -- |
Source: Public Records
Mortgage History
| Date | Status | Borrower | Loan Amount |
|---|---|---|---|
| Open | Mollette Samantha J | $125,966 | |
| Previous Owner | Mien Henry | $85,583 |
Source: Public Records
Tax History Compared to Growth
Tax History
| Year | Tax Paid | Tax Assessment Tax Assessment Total Assessment is a certain percentage of the fair market value that is determined by local assessors to be the total taxable value of land and additions on the property. | Land | Improvement |
|---|---|---|---|---|
| 2024 | $2,816 | $71,300 | $21,350 | $49,950 |
| 2023 | $2,770 | $71,295 | $21,350 | $49,945 |
| 2022 | $2,165 | $44,350 | $10,780 | $33,570 |
| 2021 | $2,208 | $44,350 | $10,780 | $33,570 |
| 2020 | $2,195 | $44,350 | $10,780 | $33,570 |
| 2019 | $2,110 | $36,620 | $9,000 | $27,620 |
| 2018 | $2,134 | $36,620 | $9,000 | $27,620 |
| 2017 | $2,130 | $36,620 | $9,000 | $27,620 |
| 2016 | $2,168 | $34,830 | $7,180 | $27,650 |
| 2015 | $2,167 | $34,830 | $7,180 | $27,650 |
| 2014 | $2,170 | $34,830 | $7,180 | $27,650 |
| 2013 | $1,077 | $36,680 | $7,560 | $29,120 |
Source: Public Records
Map
Nearby Homes
- 5732 Beechcroft Rd Unit B
- 5726 Beechcroft Rd Unit J
- 1881 Brimfield Rd
- 2084 Brookfield Rd
- 1752 Pine Tree St S Unit H
- 1743 Pine Tree St N Unit A
- 1914 Walden Dr
- 6019 Beechcroft Rd
- 2250 Webster Canyon Ct
- 1687 Brookfield Square S
- 5485 Tamarack Blvd
- 1722 Blue Ash Place
- 5556 Parkshire Dr Unit 5556
- 5522 Parkshire Dr Unit 5522
- 6035 Karl Rd
- 6245 Sharon Woods Blvd
- 6048 Pinemoor St
- 2208 Pine Knoll Ave
- 1492 Cottonwood Dr
- 2294 Teakwood Dr
- 1954 Forest Elm Ct
- 1984 Forest Elm Ct
- 1976 Forest Elm Ct
- 1960 Forest Elm Ct
- 1992 Forest Elm Ct
- 1940 Forest Elm Ct
- 1999 Forest Elm Ct
- 1991 Forest Elm Ct
- 1953 Forest Elm Ct
- 1961 Forest Elm Ct
- 1969 Forest Elm Ct
- 1981 Forest Elm Ct
- 1948 Forest Elm Ct
- 1977 E Dublin Granville Rd
- 5720 Beechcroft Rd Unit 5720
- 5720 Beechcroft Rd Unit 5720M
- 5720 Beechcroft Rd
- 5720 Beechcroft Rd Unit 5720D
- 5720 Beechcroft Rd Unit 5720A
- 5720 Beechcroft Rd Unit 5720H