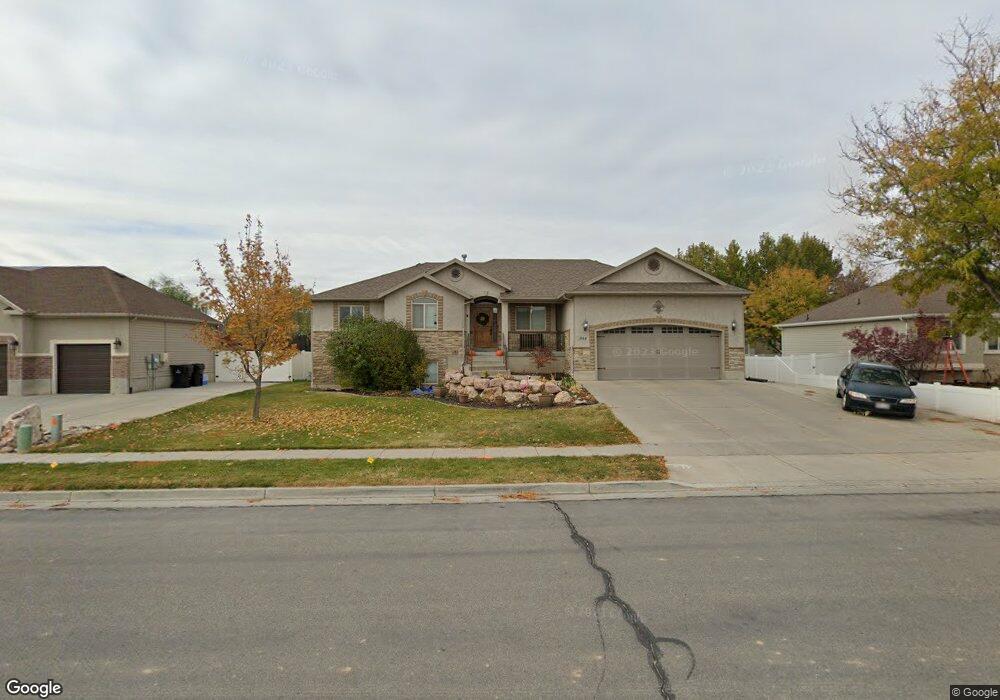
1968 S 1675 W Syracuse, UT 84075
Estimated Value: $593,000 - $629,570
6
Beds
3
Baths
3,450
Sq Ft
$176/Sq Ft
Est. Value
About This Home
This home is located at 1968 S 1675 W, Syracuse, UT 84075 and is currently estimated at $607,643, approximately $176 per square foot. 1968 S 1675 W is a home located in Davis County with nearby schools including Cook School, Syracuse Junior High School, and Syracuse High School.
Ownership History
Date
Name
Owned For
Owner Type
Purchase Details
Closed on
Apr 7, 2016
Sold by
Bray Shane
Bought by
Johnson Bradley and Johnson Heidi
Current Estimated Value
Purchase Details
Closed on
Aug 6, 2010
Sold by
Jensen Brian and Jensen Kyoko
Bought by
Bray Shane
Home Financials for this Owner
Home Financials are based on the most recent Mortgage that was taken out on this home.
Original Mortgage
$275,805
Interest Rate
4.65%
Mortgage Type
VA
Purchase Details
Closed on
Nov 10, 2009
Sold by
Taylor Jason E
Bought by
Jensen Brian G and Jensen Kyoko Y
Purchase Details
Closed on
Dec 12, 2008
Sold by
Jensen Brian G and Jensen Kyoko Y
Bought by
Jensen Brian and Jensen Kyoko
Home Financials for this Owner
Home Financials are based on the most recent Mortgage that was taken out on this home.
Original Mortgage
$197,000
Interest Rate
6.16%
Mortgage Type
New Conventional
Purchase Details
Closed on
Sep 29, 2008
Sold by
Taylor Jason E and Taylor Karalee P
Bought by
Jensen Brian G and Jensen Kyoko Y
Home Financials for this Owner
Home Financials are based on the most recent Mortgage that was taken out on this home.
Original Mortgage
$195,000
Interest Rate
6.49%
Mortgage Type
Purchase Money Mortgage
Purchase Details
Closed on
Jan 5, 2006
Sold by
Romney Michael K
Bought by
Taylor Jason E and Taylor Karalee P
Home Financials for this Owner
Home Financials are based on the most recent Mortgage that was taken out on this home.
Original Mortgage
$214,000
Interest Rate
6.12%
Mortgage Type
Fannie Mae Freddie Mac
Purchase Details
Closed on
Nov 17, 2004
Sold by
Northstar Property Development Inc
Bought by
Romney Michael K
Home Financials for this Owner
Home Financials are based on the most recent Mortgage that was taken out on this home.
Original Mortgage
$45,500
Interest Rate
5.79%
Mortgage Type
Seller Take Back
Create a Home Valuation Report for This Property
The Home Valuation Report is an in-depth analysis detailing your home's value as well as a comparison with similar homes in the area
Home Values in the Area
Average Home Value in this Area
Purchase History
| Date | Buyer | Sale Price | Title Company |
|---|---|---|---|
| Johnson Bradley | -- | Old Republic Title | |
| Bray Shane | -- | First American Title | |
| Jensen Brian G | -- | Executive Title Ins Agency | |
| Jensen Brian | -- | First American Title | |
| Jensen Brian G | -- | Executive Title Ins Agency | |
| Taylor Jason E | -- | First American Title | |
| Romney Michael K | -- | Security Title |
Source: Public Records
Mortgage History
| Date | Status | Borrower | Loan Amount |
|---|---|---|---|
| Previous Owner | Bray Shane | $275,805 | |
| Previous Owner | Jensen Brian | $197,000 | |
| Previous Owner | Jensen Brian G | $195,000 | |
| Previous Owner | Taylor Jason E | $214,000 | |
| Previous Owner | Romney Michael K | $45,500 |
Source: Public Records
Tax History Compared to Growth
Tax History
| Year | Tax Paid | Tax Assessment Tax Assessment Total Assessment is a certain percentage of the fair market value that is determined by local assessors to be the total taxable value of land and additions on the property. | Land | Improvement |
|---|---|---|---|---|
| 2025 | $3,403 | $328,350 | $123,707 | $204,643 |
| 2024 | $3,256 | $316,250 | $101,129 | $215,121 |
| 2023 | $3,130 | $554,000 | $140,978 | $413,022 |
| 2022 | $3,361 | $326,150 | $81,315 | $244,835 |
| 2021 | $2,989 | $449,000 | $120,031 | $328,969 |
| 2020 | $2,675 | $389,000 | $105,154 | $283,846 |
| 2019 | $2,570 | $369,000 | $102,057 | $266,943 |
| 2018 | $2,407 | $343,000 | $98,955 | $244,045 |
| 2016 | $2,116 | $158,125 | $38,008 | $120,117 |
| 2015 | $2,208 | $157,135 | $38,008 | $119,127 |
| 2014 | $1,995 | $144,678 | $38,008 | $106,670 |
| 2013 | -- | $138,980 | $32,571 | $106,409 |
Source: Public Records
Map
Nearby Homes