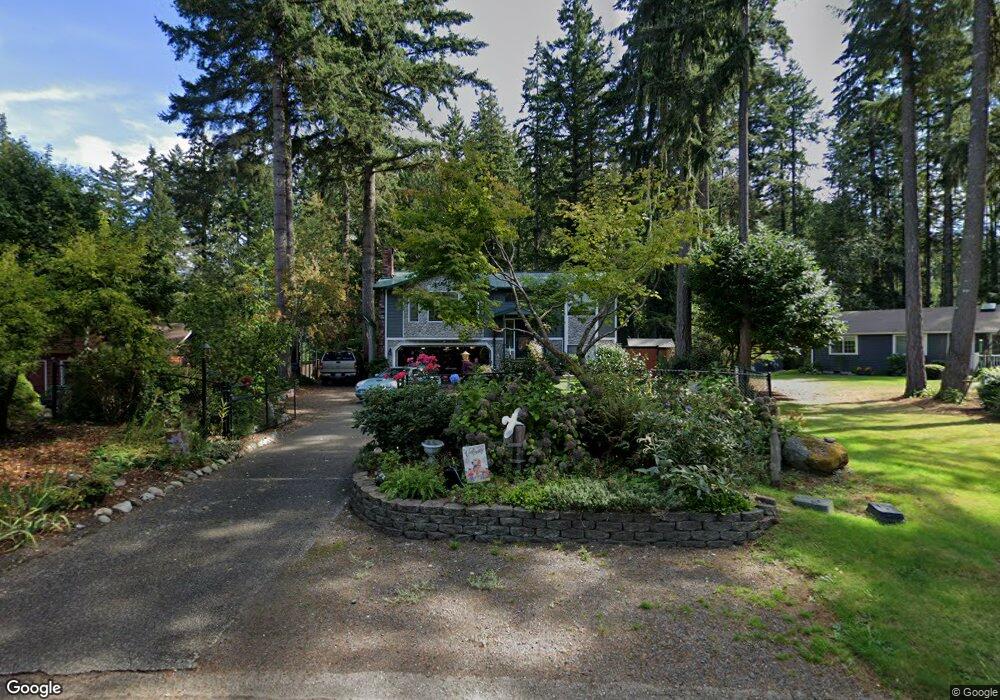
1968 SE Karli Way Port Orchard, WA 98367
Bethel NeighborhoodEstimated Value: $508,000 - $556,000
2
Beds
2
Baths
1,140
Sq Ft
$469/Sq Ft
Est. Value
About This Home
This home is located at 1968 SE Karli Way, Port Orchard, WA 98367 and is currently estimated at $534,298, approximately $468 per square foot. 1968 SE Karli Way is a home located in Kitsap County with nearby schools including Hidden Creek Elementary School, Marcus Whitman Middle School, and South Kitsap High School.
Ownership History
Date
Name
Owned For
Owner Type
Purchase Details
Closed on
Jan 7, 2020
Sold by
Martin Michael and Martin Joy
Bought by
Martin Michael Allan and Martin Allan
Current Estimated Value
Purchase Details
Closed on
Jul 2, 2007
Sold by
Dettloff Darrin and Dettloff Terri
Bought by
Martin Michael and Martin Joy
Purchase Details
Closed on
Sep 5, 2001
Sold by
Rojas Daniel
Bought by
Dettloff Darrin and Dettloff Terri
Home Financials for this Owner
Home Financials are based on the most recent Mortgage that was taken out on this home.
Original Mortgage
$121,200
Interest Rate
7%
Purchase Details
Closed on
May 5, 1995
Sold by
Rojas Claire H Favro and Favro Claire H
Bought by
Rojas Daniel
Create a Home Valuation Report for This Property
The Home Valuation Report is an in-depth analysis detailing your home's value as well as a comparison with similar homes in the area
Home Values in the Area
Average Home Value in this Area
Purchase History
| Date | Buyer | Sale Price | Title Company |
|---|---|---|---|
| Martin Michael Allan | -- | None Available | |
| Martin Michael | $267,180 | Land Title Company | |
| Dettloff Darrin | $151,500 | Transnation Title Insurance | |
| Rojas Daniel | -- | -- |
Source: Public Records
Mortgage History
| Date | Status | Borrower | Loan Amount |
|---|---|---|---|
| Previous Owner | Dettloff Darrin | $121,200 | |
| Closed | Dettloff Darrin | $15,150 |
Source: Public Records
Tax History Compared to Growth
Tax History
| Year | Tax Paid | Tax Assessment Tax Assessment Total Assessment is a certain percentage of the fair market value that is determined by local assessors to be the total taxable value of land and additions on the property. | Land | Improvement |
|---|---|---|---|---|
| 2026 | $3,955 | $449,720 | $98,980 | $350,740 |
| 2025 | $3,955 | $449,720 | $98,980 | $350,740 |
| 2024 | $3,835 | $449,720 | $98,980 | $350,740 |
| 2023 | $3,810 | $449,720 | $98,980 | $350,740 |
| 2022 | $3,651 | $360,830 | $79,180 | $281,650 |
| 2021 | $3,393 | $316,930 | $70,700 | $246,230 |
| 2020 | $3,261 | $295,750 | $64,460 | $231,290 |
| 2019 | $2,764 | $274,590 | $59,820 | $214,770 |
| 2018 | $2,925 | $224,430 | $54,140 | $170,290 |
| 2017 | $2,490 | $224,430 | $54,140 | $170,290 |
| 2016 | $2,446 | $201,820 | $51,570 | $150,250 |
| 2015 | $2,368 | $197,970 | $51,570 | $146,400 |
| 2014 | -- | $174,190 | $58,660 | $115,530 |
| 2013 | -- | $206,860 | $77,090 | $129,770 |
Source: Public Records
Map
Nearby Homes
- 0 SE Bethel Rd Unit NWM2437882
- 5673 Bethel Rd SE Unit 28
- 6830 Arlington Place SE
- 1577 SE Oregon St
- 6146 Windlass Ave SE
- 2670 SE Bielmeier Rd
- 2430 SE Celebrity Ct
- 5 XXX Ferate Ave SE
- 2426 SE Celebrity Ct
- 6498 Skipper Ln SE
- 5230 Bethel Rd SE
- 5184 Granada Place SE
- 6685 Skipper Ln SE
- 3371 SE Bielmeier Rd Unit 85
- 3371 SE Bielmeier Rd Unit 47
- 3371 SE Bielmeier Rd Unit 26
- 3371 SE Bielmeier Rd Unit 91
- 3371 SE Bielmeier Rd Unit 79
- 3371 SE Bielmeier Rd Unit 80
- 3371 SE Bielmeier Rd Unit 95
- 1976 SE Karli Way
- 1960 SE Karli Way
- 1952 SE Karli Way
- 1984 SE Karli Way
- 2132 SE Aztec Ct
- 2137 SE Aztec Ct
- 1967 SE Karli Way
- 1954 SE Krista St
- 1992 SE Karli Way
- 1944 SE Karli Way
- 2123 SE van Skiver Rd
- 2138 SE Aztec Ct
- 1947 SE Karli Way
- 1932 SE Krista St
- 2241 SE van Skiver Rd
- 1936 SE Karli Way
- 1939 SE Karli Way
- 1924 SE Krista St
- 2144 SE Aztec Ct
- 1949 SE Krista St