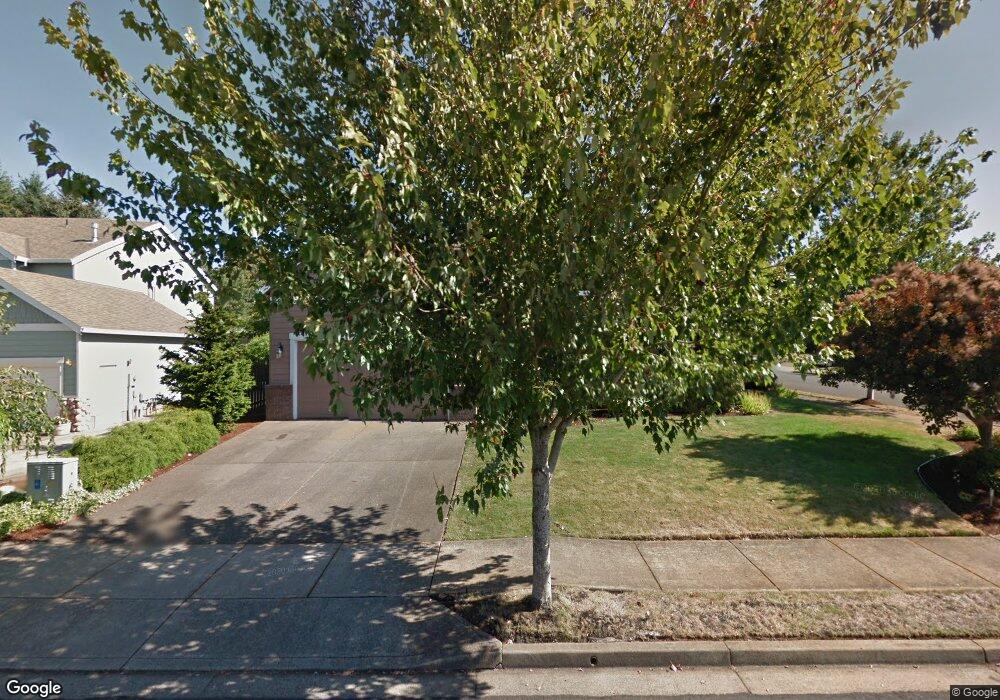
19699 Schaefer Dr Oregon City, OR 97045
Gaffney Lane NeighborhoodEstimated Value: $652,000 - $694,000
4
Beds
3
Baths
2,321
Sq Ft
$287/Sq Ft
Est. Value
About This Home
This home is located at 19699 Schaefer Dr, Oregon City, OR 97045 and is currently estimated at $666,434, approximately $287 per square foot. 19699 Schaefer Dr is a home located in Clackamas County with nearby schools including Gaffney Lane Elementary School, Gardiner Middle School, and Oregon City Senior High School.
Ownership History
Date
Name
Owned For
Owner Type
Purchase Details
Closed on
Aug 9, 2018
Sold by
Guelsdorf Kurt F and Guelsdorf Kristin C
Bought by
Guelsdorf Family Living Trust
Current Estimated Value
Purchase Details
Closed on
Jun 30, 2005
Sold by
Noel Lloyd G and Noel Angela J
Bought by
Guelsdorf Kurt F and Guelsdorf Kristin C
Home Financials for this Owner
Home Financials are based on the most recent Mortgage that was taken out on this home.
Original Mortgage
$46,425
Interest Rate
5.13%
Mortgage Type
Stand Alone Second
Purchase Details
Closed on
Jun 22, 2001
Sold by
Cj Custom Homes Llc
Bought by
Noel Lloyd and Noel Angela
Home Financials for this Owner
Home Financials are based on the most recent Mortgage that was taken out on this home.
Original Mortgage
$229,400
Interest Rate
7.14%
Purchase Details
Closed on
Jun 21, 2000
Sold by
Van Wijnen Northwest Inc
Bought by
Cj Custom Homes Llc
Create a Home Valuation Report for This Property
The Home Valuation Report is an in-depth analysis detailing your home's value as well as a comparison with similar homes in the area
Home Values in the Area
Average Home Value in this Area
Purchase History
| Date | Buyer | Sale Price | Title Company |
|---|---|---|---|
| Guelsdorf Family Living Trust | -- | None Available | |
| Guelsdorf Kurt F | $309,500 | Chicago Title Insurance Co | |
| Noel Lloyd | $241,518 | Fidelity National Title Co | |
| Cj Custom Homes Llc | $57,500 | Fidelity National Title Co |
Source: Public Records
Mortgage History
| Date | Status | Borrower | Loan Amount |
|---|---|---|---|
| Closed | Guelsdorf Kurt F | $46,425 | |
| Open | Guelsdorf Kurt F | $247,600 | |
| Previous Owner | Noel Lloyd | $229,400 |
Source: Public Records
Tax History Compared to Growth
Tax History
| Year | Tax Paid | Tax Assessment Tax Assessment Total Assessment is a certain percentage of the fair market value that is determined by local assessors to be the total taxable value of land and additions on the property. | Land | Improvement |
|---|---|---|---|---|
| 2025 | $7,471 | $372,919 | -- | -- |
| 2024 | $6,777 | $362,058 | -- | -- |
| 2023 | $6,777 | $351,513 | $0 | $0 |
| 2022 | $6,236 | $341,275 | $0 | $0 |
| 2021 | $5,985 | $331,335 | $0 | $0 |
| 2020 | $5,814 | $321,685 | $0 | $0 |
| 2019 | $5,691 | $312,316 | $0 | $0 |
| 2018 | $5,408 | $303,219 | $0 | $0 |
| 2017 | $5,268 | $294,387 | $0 | $0 |
| 2016 | $5,172 | $285,813 | $0 | $0 |
| 2015 | $5,041 | $277,488 | $0 | $0 |
| 2014 | $4,898 | $269,406 | $0 | $0 |
Source: Public Records
Map
Nearby Homes
- 13204 Gaffney Ln
- 13172 Gaffney Ln
- 19865 Castleberry Loop
- 19751 Falcon Dr
- 19573 Toni Ct
- 13631 S Squire Dr
- 19474 Wild Bill Ct
- 13197 Moccasin Way
- 19451 Prairie View Terrace
- 19537 Morrie Dr
- 13191 Autumn Ln
- 19386 Juniper Ct
- 19356 Juniper Ct
- 13899 Traveler Rd
- 13548 Gaffney Ln
- 13910 Caufield Rd
- 19903 Leland Rd
- 12795 Lindsay Anne Ln
- 13531 Clairmont Way Unit 165
- 13531 Clairmont Way Unit 55
- 19693 Schaefer Dr
- 19687 Schaefer Dr
- 13336 S Nobel Rd
- 13333 S Nobel Rd
- 13301 S Nobel Rd
- 13348 S Nobel Rd
- 19692 Schaefer Dr
- 13300 S Nobel Rd
- 19681 Schaefer Dr
- 19711 Schaefer Dr
- 19686 Schaefer Dr
- 13289 S Nobel Rd
- 13351 S Nobel Rd
- 13360 S Nobel Rd
- 13303 James Ct
- 13288 S Nobel Rd
- 19677 Schaefer Dr
- 13309 James Ct
- 19710 Schaefer Dr
- 13208 Gaffney Ln