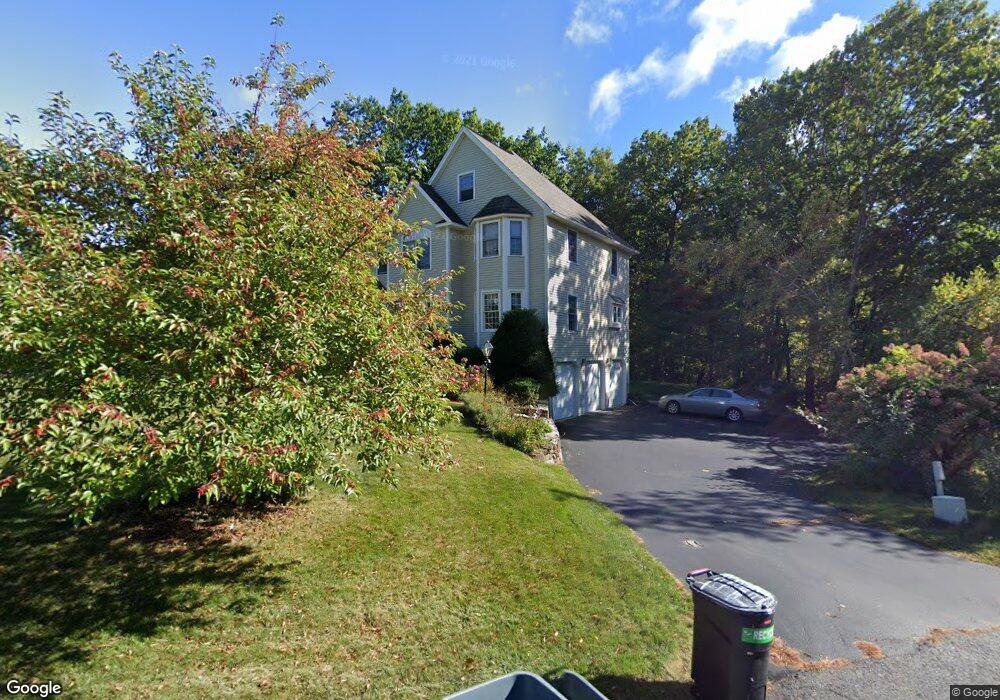
197 Bridges Ln North Andover, MA 01845
Estimated Value: $1,070,000 - $1,262,000
3
Beds
3
Baths
3,150
Sq Ft
$362/Sq Ft
Est. Value
About This Home
This home is located at 197 Bridges Ln, North Andover, MA 01845 and is currently estimated at $1,141,219, approximately $362 per square foot. 197 Bridges Ln is a home located in Essex County with nearby schools including Annie L Sargent Elementary School, North Andover Middle School, and North Andover High School.
Ownership History
Date
Name
Owned For
Owner Type
Purchase Details
Closed on
Jan 22, 2023
Sold by
Higgins Thomas M and Higgins Linda A
Bought by
Tl Higgins T
Current Estimated Value
Purchase Details
Closed on
Jun 13, 1997
Sold by
Land Merchants Inc
Bought by
Higgins Thomas M
Home Financials for this Owner
Home Financials are based on the most recent Mortgage that was taken out on this home.
Original Mortgage
$260,000
Interest Rate
7.97%
Mortgage Type
Purchase Money Mortgage
Purchase Details
Closed on
Dec 24, 1996
Sold by
Contrada Joseph G
Bought by
Land Merchants Inc
Home Financials for this Owner
Home Financials are based on the most recent Mortgage that was taken out on this home.
Original Mortgage
$251,000
Interest Rate
7.62%
Mortgage Type
Purchase Money Mortgage
Create a Home Valuation Report for This Property
The Home Valuation Report is an in-depth analysis detailing your home's value as well as a comparison with similar homes in the area
Home Values in the Area
Average Home Value in this Area
Purchase History
| Date | Buyer | Sale Price | Title Company |
|---|---|---|---|
| Tl Higgins T | -- | None Available | |
| Higgins Thomas M | $330,000 | -- | |
| Land Merchants Inc | $113,500 | -- |
Source: Public Records
Mortgage History
| Date | Status | Borrower | Loan Amount |
|---|---|---|---|
| Previous Owner | Land Merchants Inc | $220,000 | |
| Previous Owner | Land Merchants Inc | $260,000 | |
| Previous Owner | Land Merchants Inc | $251,000 |
Source: Public Records
Tax History Compared to Growth
Tax History
| Year | Tax Paid | Tax Assessment Tax Assessment Total Assessment is a certain percentage of the fair market value that is determined by local assessors to be the total taxable value of land and additions on the property. | Land | Improvement |
|---|---|---|---|---|
| 2025 | $11,098 | $985,600 | $414,300 | $571,300 |
| 2024 | $10,570 | $953,100 | $392,500 | $560,600 |
| 2023 | $10,092 | $824,500 | $331,500 | $493,000 |
| 2022 | $9,593 | $709,000 | $287,900 | $421,100 |
| 2021 | $9,213 | $650,200 | $261,800 | $388,400 |
| 2020 | $8,843 | $643,600 | $255,200 | $388,400 |
| 2019 | $8,631 | $643,600 | $255,200 | $388,400 |
| 2018 | $9,352 | $643,600 | $255,200 | $388,400 |
| 2017 | $7,691 | $538,600 | $224,600 | $314,000 |
| 2016 | $7,340 | $514,400 | $226,800 | $287,600 |
| 2015 | $7,474 | $519,400 | $213,400 | $306,000 |
Source: Public Records
Map
Nearby Homes
- 590 Foster St
- 121 Cortland Dr
- Lot 10 Stonecleave Rd
- 114 Stonecleave Rd
- 141 Cortland Dr Unit 141
- 141 Cortland Dr
- 45 Thistle Rd
- 75 Thistle Rd
- 378 Salem St
- 10 Woodchuck Ln
- 65 Saile Way
- 495 Johnson St
- 499 Main St
- 12 Farnum St
- 53 Lawrence Rd
- 80 Sandra Ln
- Lot 2 (31) Lawrence Rd
- 427b Ipswich Rd
- 34 Rosemont Dr
- 50 Stonecleave Rd