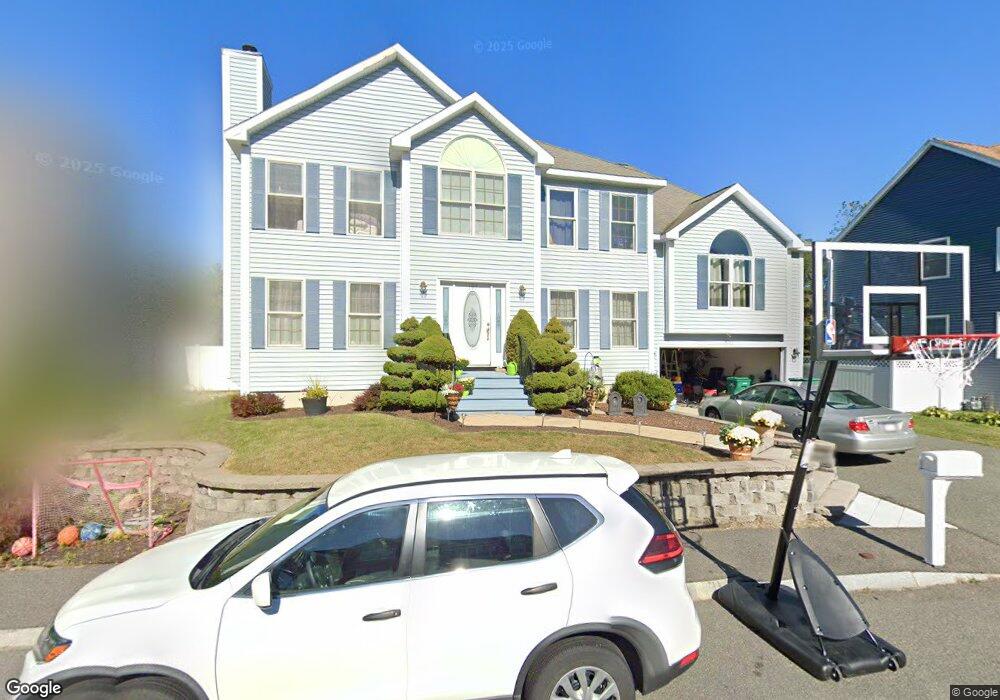
197 Judge Rd Lynn, MA 01904
Lynn Woods NeighborhoodEstimated Value: $903,000 - $1,001,000
4
Beds
3
Baths
2,877
Sq Ft
$331/Sq Ft
Est. Value
About This Home
This home is located at 197 Judge Rd, Lynn, MA 01904 and is currently estimated at $952,006, approximately $330 per square foot. 197 Judge Rd is a home located in Essex County with nearby schools including Capt. William G. Shoemaker Elementary School, William R. Fallon School, and New Paths Area Learning Center.
Ownership History
Date
Name
Owned For
Owner Type
Purchase Details
Closed on
May 23, 2003
Sold by
Stoneybrook Rt and Miles Michael T
Bought by
Bursey Derek L
Current Estimated Value
Home Financials for this Owner
Home Financials are based on the most recent Mortgage that was taken out on this home.
Original Mortgage
$339,570
Interest Rate
5.86%
Mortgage Type
Purchase Money Mortgage
Create a Home Valuation Report for This Property
The Home Valuation Report is an in-depth analysis detailing your home's value as well as a comparison with similar homes in the area
Home Values in the Area
Average Home Value in this Area
Purchase History
| Date | Buyer | Sale Price | Title Company |
|---|---|---|---|
| Bursey Derek L | $189,900 | -- | |
| Bursey Derek L | $189,900 | -- |
Source: Public Records
Mortgage History
| Date | Status | Borrower | Loan Amount |
|---|---|---|---|
| Open | Bursey Derek L | $472,000 | |
| Closed | Bursey Derek L | $50,000 | |
| Closed | Bursey Derek L | $339,570 |
Source: Public Records
Tax History Compared to Growth
Tax History
| Year | Tax Paid | Tax Assessment Tax Assessment Total Assessment is a certain percentage of the fair market value that is determined by local assessors to be the total taxable value of land and additions on the property. | Land | Improvement |
|---|---|---|---|---|
| 2025 | $10,039 | $969,000 | $207,900 | $761,100 |
| 2024 | $9,656 | $917,000 | $199,400 | $717,600 |
| 2023 | $9,552 | $856,700 | $221,900 | $634,800 |
| 2022 | $9,381 | $754,700 | $165,000 | $589,700 |
| 2021 | $8,859 | $679,900 | $159,100 | $520,800 |
| 2020 | $8,717 | $650,500 | $150,600 | $499,900 |
| 2019 | $8,353 | $584,100 | $127,500 | $456,600 |
| 2018 | $8,379 | $553,100 | $152,400 | $400,700 |
| 2017 | $8,139 | $521,700 | $142,400 | $379,300 |
| 2016 | $7,936 | $490,500 | $132,600 | $357,900 |
| 2015 | $7,663 | $457,500 | $131,200 | $326,300 |
Source: Public Records
Map
Nearby Homes
- 63 Crooker Dr
- 115 Quinn Rd
- 10 Standish Way
- 714 Lynnfield St
- 50 Cumberland Cir
- 28 Elmwood Cir
- 1100 Salem St Unit 58
- 1100 Salem St Unit 75
- 45 Anchor Rd
- 3 Ralph Rd
- 37 Locust St
- 12 Mansfield St
- 16 Sarah's Way
- 2 Witham St
- 2 Anchor Rd
- 325 Den Quarry Rd
- 217 Cedar Brook Rd
- 1200 Salem St Unit 127
- 1200 Salem St Unit 182
- 16 Munroe St