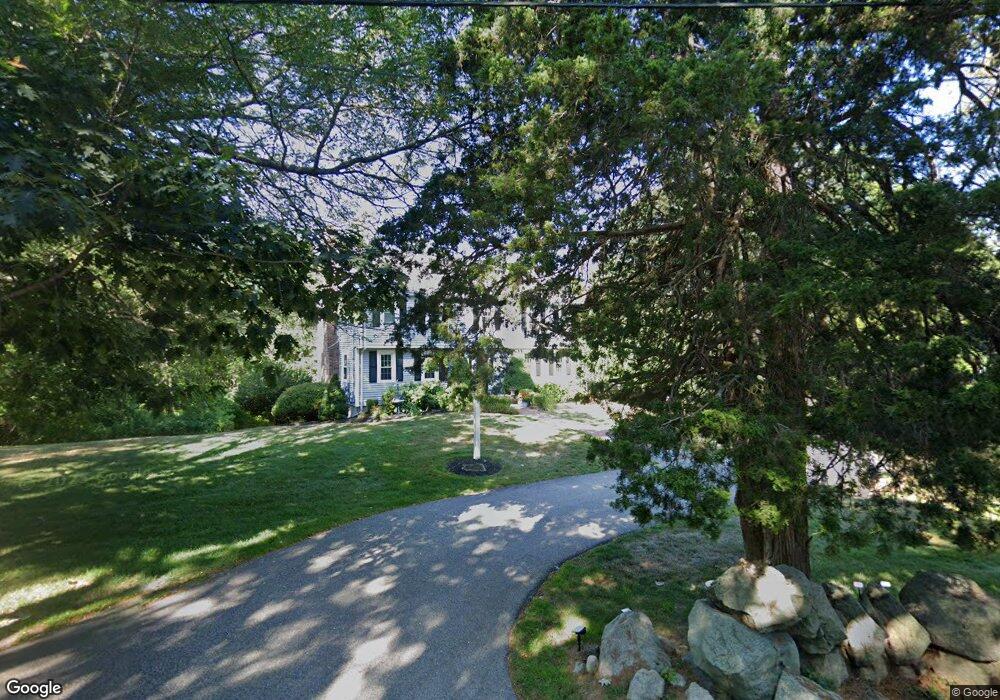
197 Lazell St Hingham, MA 02043
Estimated Value: $1,434,000 - $1,644,000
5
Beds
3
Baths
2,608
Sq Ft
$573/Sq Ft
Est. Value
About This Home
This home is located at 197 Lazell St, Hingham, MA 02043 and is currently estimated at $1,494,116, approximately $572 per square foot. 197 Lazell St is a home located in Plymouth County with nearby schools including East Elementary School, Hingham Middle School, and Hingham High School.
Ownership History
Date
Name
Owned For
Owner Type
Purchase Details
Closed on
May 11, 2005
Sold by
Svendsen Craig A and Svendsen Kristin K
Bought by
Henderson Callum D and Henderson Michelle
Current Estimated Value
Purchase Details
Closed on
Feb 27, 2002
Sold by
Dwyer Michael P and Mignacca Kathleen M
Bought by
Svendsen Craig A and Klaine Kristin L
Purchase Details
Closed on
May 28, 1999
Sold by
Scheiring Robert J and Scheiring Nancy J
Bought by
Dwyer Michael P and Mignacca Kathleen M
Purchase Details
Closed on
May 2, 1996
Sold by
Bitner Robert J and Bitner Penny N
Bought by
Scheiring Robert J and Scheirging Nancy J
Create a Home Valuation Report for This Property
The Home Valuation Report is an in-depth analysis detailing your home's value as well as a comparison with similar homes in the area
Purchase History
| Date | Buyer | Sale Price | Title Company |
|---|---|---|---|
| Henderson Callum D | $740,000 | -- | |
| Svendsen Craig A | $575,000 | -- | |
| Dwyer Michael P | $436,885 | -- | |
| Scheiring Robert J | $335,000 | -- |
Source: Public Records
Mortgage History
| Date | Status | Borrower | Loan Amount |
|---|---|---|---|
| Open | Scheiring Robert J | $370,000 | |
| Closed | Scheiring Robert J | $50,000 |
Source: Public Records
Tax History
| Year | Tax Paid | Tax Assessment Tax Assessment Total Assessment is a certain percentage of the fair market value that is determined by local assessors to be the total taxable value of land and additions on the property. | Land | Improvement |
|---|---|---|---|---|
| 2025 | $13,499 | $1,262,800 | $540,700 | $722,100 |
| 2024 | $13,021 | $1,200,100 | $540,700 | $659,400 |
| 2023 | $11,409 | $1,140,900 | $540,700 | $600,200 |
| 2022 | $10,838 | $937,500 | $447,800 | $489,700 |
| 2021 | $10,559 | $894,800 | $447,800 | $447,000 |
| 2020 | $10,317 | $894,800 | $447,800 | $447,000 |
| 2019 | $9,704 | $821,700 | $447,800 | $373,900 |
| 2018 | $9,671 | $821,700 | $447,800 | $373,900 |
| 2017 | $10,062 | $821,400 | $446,200 | $375,200 |
| 2016 | $9,994 | $800,200 | $425,000 | $375,200 |
| 2015 | $9,771 | $779,800 | $404,600 | $375,200 |
Source: Public Records
Map
Nearby Homes
Your Personal Tour Guide
Ask me questions while you tour the home.