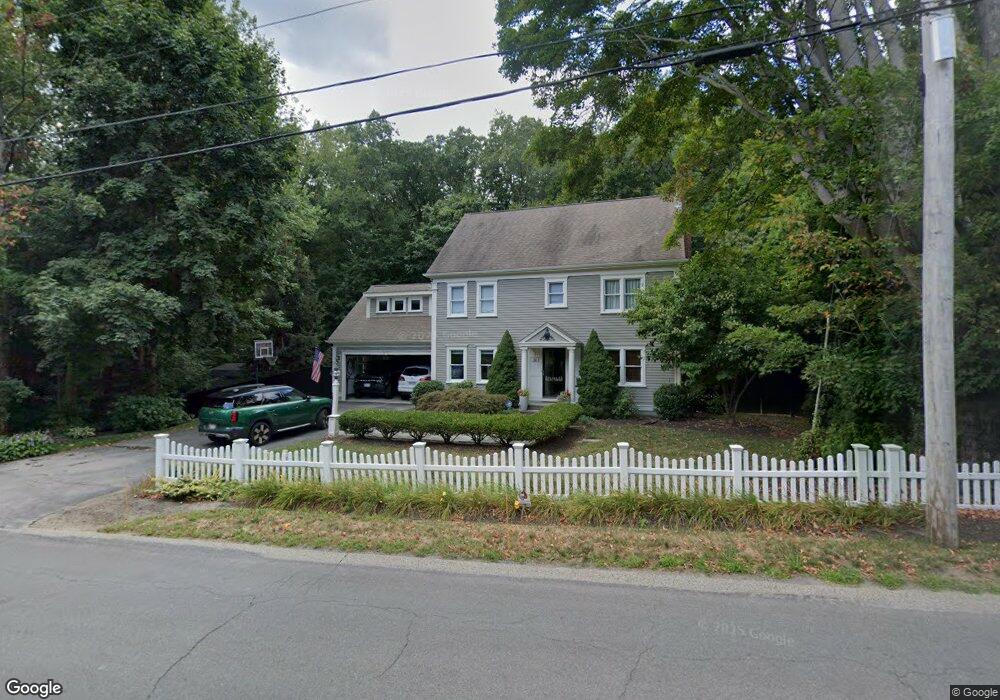
197 Newbridge St Hingham, MA 02043
Estimated Value: $1,280,000 - $1,688,000
3
Beds
3
Baths
2,104
Sq Ft
$690/Sq Ft
Est. Value
About This Home
This home is located at 197 Newbridge St, Hingham, MA 02043 and is currently estimated at $1,452,722, approximately $690 per square foot. 197 Newbridge St is a home located in Plymouth County with nearby schools including Plymouth River Elementary School, Hingham Middle School, and Hingham High School.
Ownership History
Date
Name
Owned For
Owner Type
Purchase Details
Closed on
Mar 14, 2002
Sold by
C&J New Bridge Rt and Jacobs Stephen V
Bought by
Seibel Scott J and Seibel Nancy A
Current Estimated Value
Home Financials for this Owner
Home Financials are based on the most recent Mortgage that was taken out on this home.
Original Mortgage
$400,000
Interest Rate
7.04%
Mortgage Type
Purchase Money Mortgage
Purchase Details
Closed on
May 23, 2001
Sold by
Cutting Dorothy G and Cutting Albert R
Bought by
Jacobs Stephen and Cutting Robert R
Home Financials for this Owner
Home Financials are based on the most recent Mortgage that was taken out on this home.
Original Mortgage
$312,500
Interest Rate
7.05%
Mortgage Type
Purchase Money Mortgage
Create a Home Valuation Report for This Property
The Home Valuation Report is an in-depth analysis detailing your home's value as well as a comparison with similar homes in the area
Purchase History
| Date | Buyer | Sale Price | Title Company |
|---|---|---|---|
| Seibel Scott J | $570,000 | -- | |
| Jacobs Stephen | $250,000 | -- |
Source: Public Records
Mortgage History
| Date | Status | Borrower | Loan Amount |
|---|---|---|---|
| Open | Jacobs Stephen | $300,600 | |
| Closed | Jacobs Stephen | $313,300 | |
| Closed | Jacobs Stephen | $400,000 | |
| Previous Owner | Jacobs Stephen | $312,500 |
Source: Public Records
Tax History
| Year | Tax Paid | Tax Assessment Tax Assessment Total Assessment is a certain percentage of the fair market value that is determined by local assessors to be the total taxable value of land and additions on the property. | Land | Improvement |
|---|---|---|---|---|
| 2025 | $12,909 | $1,207,600 | $499,600 | $708,000 |
| 2024 | $12,506 | $1,152,600 | $499,600 | $653,000 |
| 2023 | $10,931 | $1,093,100 | $499,600 | $593,500 |
| 2022 | $9,930 | $859,000 | $385,500 | $473,500 |
| 2021 | $9,755 | $826,700 | $385,500 | $441,200 |
| 2020 | $9,532 | $826,700 | $385,500 | $441,200 |
| 2019 | $9,426 | $798,100 | $385,500 | $412,600 |
| 2018 | $9,394 | $798,100 | $385,500 | $412,600 |
| 2017 | $9,036 | $737,600 | $394,300 | $343,300 |
| 2016 | $8,977 | $718,700 | $375,400 | $343,300 |
| 2015 | $8,777 | $700,500 | $357,200 | $343,300 |
Source: Public Records
Map
Nearby Homes
- 193 Newbridge St
- 204 Newbridge St
- 185 Newbridge St
- 208 Newbridge St
- 119 Hobart St
- 182 Newbridge St
- 177 Newbridge St
- 133 Hobart St
- 117 Hobart St
- 186 Newbridge St
- 139 Hobart St
- 2 Sayles Rd
- 176 Newbridge St
- 101 Hobart St
- 143 Hobart St
- 171 Newbridge St
- 118 Hobart St
- 4 Sayles Rd
- 4 Sayles Rd
- 7 Golfview Dr
Your Personal Tour Guide
Ask me questions while you tour the home.