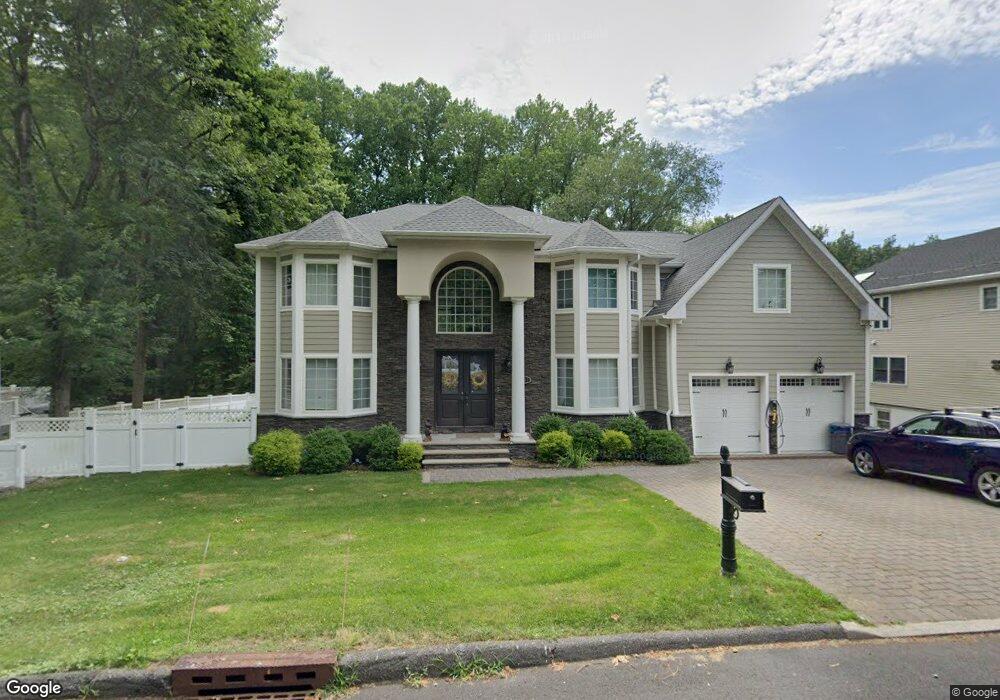
197 Pine St Haworth, NJ 07641
Estimated Value: $1,806,624 - $2,087,000
5
Beds
6
Baths
4,127
Sq Ft
$475/Sq Ft
Est. Value
About This Home
This home is located at 197 Pine St, Haworth, NJ 07641 and is currently estimated at $1,960,656, approximately $475 per square foot. 197 Pine St is a home located in Bergen County with nearby schools including Haworth Elementary School, Northern Valley Regional High School at Demarest, and Acton Academy of Bergen County.
Ownership History
Date
Name
Owned For
Owner Type
Purchase Details
Closed on
Jun 15, 2017
Sold by
Nmcg Llc and Seriani Malak
Bought by
Ngai Ivan and Kim Kyung Min
Current Estimated Value
Home Financials for this Owner
Home Financials are based on the most recent Mortgage that was taken out on this home.
Original Mortgage
$1,036,000
Outstanding Balance
$861,736
Interest Rate
4.02%
Mortgage Type
Commercial
Estimated Equity
$1,098,920
Purchase Details
Closed on
May 23, 2017
Sold by
Nmcg Llc
Bought by
Nmcg Llc and Nmcg Construction Llc
Home Financials for this Owner
Home Financials are based on the most recent Mortgage that was taken out on this home.
Original Mortgage
$1,036,000
Outstanding Balance
$861,736
Interest Rate
4.02%
Mortgage Type
Commercial
Estimated Equity
$1,098,920
Purchase Details
Closed on
Mar 15, 2016
Sold by
Fyfe William
Bought by
Nmcg Llc
Purchase Details
Closed on
Jul 21, 2004
Create a Home Valuation Report for This Property
The Home Valuation Report is an in-depth analysis detailing your home's value as well as a comparison with similar homes in the area
Home Values in the Area
Average Home Value in this Area
Purchase History
| Date | Buyer | Sale Price | Title Company |
|---|---|---|---|
| Ngai Ivan | $1,295,000 | Fidelity National Title | |
| Nmcg Llc | -- | None Available | |
| Nmcg Llc | $435,000 | None Available | |
| -- | -- | -- |
Source: Public Records
Mortgage History
| Date | Status | Borrower | Loan Amount |
|---|---|---|---|
| Open | Ngai Ivan | $1,036,000 |
Source: Public Records
Tax History Compared to Growth
Tax History
| Year | Tax Paid | Tax Assessment Tax Assessment Total Assessment is a certain percentage of the fair market value that is determined by local assessors to be the total taxable value of land and additions on the property. | Land | Improvement |
|---|---|---|---|---|
| 2025 | $33,251 | $1,075,400 | $280,400 | $795,000 |
| 2024 | $32,714 | $1,075,400 | $280,400 | $795,000 |
| 2023 | $32,036 | $1,075,400 | $280,400 | $795,000 |
| 2022 | $32,036 | $1,075,400 | $280,400 | $795,000 |
| 2021 | $31,660 | $1,075,400 | $280,400 | $795,000 |
| 2020 | $31,391 | $1,075,400 | $280,400 | $795,000 |
| 2019 | $31,305 | $1,075,400 | $280,400 | $795,000 |
| 2018 | $30,832 | $1,075,400 | $280,400 | $795,000 |
| 2017 | $8,084 | $280,400 | $280,400 | $0 |
| 2016 | $11,593 | $398,400 | $280,400 | $118,000 |
| 2015 | $11,135 | $398,400 | $280,400 | $118,000 |
| 2014 | $10,964 | $398,400 | $280,400 | $118,000 |
Source: Public Records
Map
Nearby Homes
- 226 Haworth Ave
- 159 Delaware Ave
- 308 Garfield St
- 129 Knickerbocker Rd
- 56 Valley Rd
- 34 Summit Place
- 308 Spring Ln
- 34 Valley Rd
- 51 Harrison St
- 58 Van Horn St
- 123 Pearl St
- 130 Durie Ave
- 97 Prescott St
- 98 Prescott St
- 30 Hardenburgh Ave
- 106 Prescott St
- 84 Garfield St
- 110 Mason Ct Unit 3H
- 287 Lake Shore Dr
- 214 Durie Ave
- 191 Pine St
- 205 Pine St
- 187 Pine St
- 153 Madison Ave
- 181 Madison Ave
- 210 Pine St
- 215 Pine St
- 197 Schraalenburgh Rd
- 187 Schraalenburgh Rd
- 209 Schraalenburgh Rd
- 225 Pine St
- 170 Madison Ave
- 226 Pine St
- 180 Madison Ave
- 219 Schraalenburgh Rd
- 180 Beacon St
- 173 Schraalenburgh Rd
- 225 Schraalenburgh Rd
- 190 Schraalenburgh Rd
- 245 Pine St