197 Redbone Run Barnesville, GA 30204
Estimated Value: $433,000 - $705,000
3
Beds
3
Baths
2,519
Sq Ft
$235/Sq Ft
Est. Value
About This Home
This home is located at 197 Redbone Run, Barnesville, GA 30204 and is currently estimated at $592,485, approximately $235 per square foot. 197 Redbone Run is a home with nearby schools including Lamar County Primary School, Lamar County Elementary School, and Lamar County Middle School.
Ownership History
Date
Name
Owned For
Owner Type
Purchase Details
Closed on
Jul 25, 2006
Sold by
Moye Thomas Floyd
Bought by
Scharnhorst Wiley E
Current Estimated Value
Create a Home Valuation Report for This Property
The Home Valuation Report is an in-depth analysis detailing your home's value as well as a comparison with similar homes in the area
Purchase History
| Date | Buyer | Sale Price | Title Company |
|---|---|---|---|
| Scharnhorst Wiley E | $100,000 | -- |
Source: Public Records
Tax History
| Year | Tax Paid | Tax Assessment Tax Assessment Total Assessment is a certain percentage of the fair market value that is determined by local assessors to be the total taxable value of land and additions on the property. | Land | Improvement |
|---|---|---|---|---|
| 2025 | $5,138 | $228,016 | $37,928 | $190,088 |
| 2024 | $4,906 | $193,588 | $37,928 | $155,660 |
| 2023 | $5,333 | $195,090 | $37,928 | $157,162 |
| 2022 | $4,639 | $169,950 | $23,156 | $146,794 |
| 2021 | $3,850 | $129,941 | $25,729 | $104,212 |
| 2020 | $4,053 | $129,941 | $25,729 | $104,212 |
| 2019 | $4,063 | $129,941 | $25,729 | $104,212 |
| 2018 | $3,902 | $129,941 | $25,729 | $104,212 |
| 2017 | $3,881 | $129,941 | $25,729 | $104,212 |
| 2016 | $3,882 | $129,941 | $25,729 | $104,212 |
| 2015 | $3,542 | $116,973 | $25,729 | $91,244 |
| 2014 | $1,276 | $43,494 | $25,729 | $17,765 |
| 2013 | -- | $43,493 | $25,728 | $17,764 |
Source: Public Records
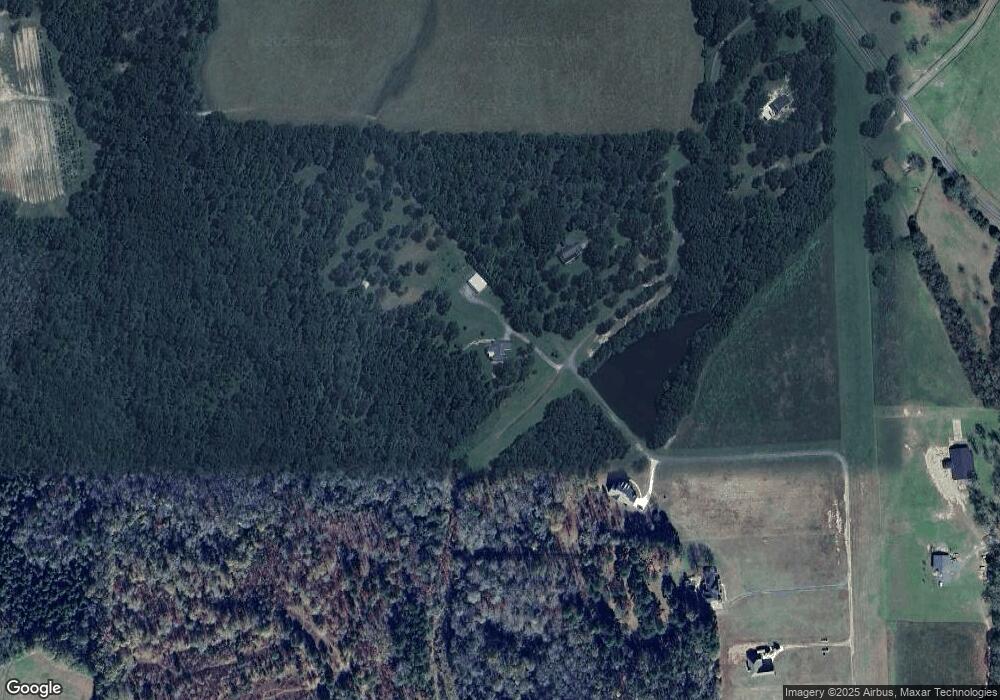
Map
Nearby Homes
- 202 Community House Rd
- 208 Community House Rd
- 272 Community House Rd
- 1904 U S 341
- 336 Means Rd
- 342 Ramah Church Rd
- TRACT 6 Ramah Church Rd Unit 6
- TRACT 9 Ramah Church Rd Unit 9
- 1505 Willis Rd
- 1787 Ramah Church Rd
- 250 Perdue Rd
- 187 Coffey Rd
- 0 Us Highway 41
- 330 Country Kitchen Rd
- 395 Country Kitchen Rd
- 523 Fredonia Church Rd
- 1013 Veterans Pkwy
- 108 Bradley Cir
- 0 Martin Luther King Junior Pkwy
- 329 Pine St
- 183 Redbone Run
- 199 Redbone Run
- 129 Redbone Run
- 120 Redbone Run
- 155 Redbone Run
- 264 Leverette Rd
- 167 Redbone Run
- 553 Community House Rd
- 181 Redbone Run
- 119 Steeplechase
- 410 Community House Rd
- 199 Redbone Run
- 131 Steeplechase
- 510 Community House Rd
- 145 Steeplechase
- 358 Community House Rd
- 167 Redbone Run Taxiway Unit 24
- 119 Steeplechase Ln
- 160 Sappington Rd
- 169 Steeplechase Unit 12/082-040
Your Personal Tour Guide
Ask me questions while you tour the home.